Can you help me figure out how to create multiple value axes?
It's possible in Kendo Charts, but can't figure out how to apply it in Dashboard Designer
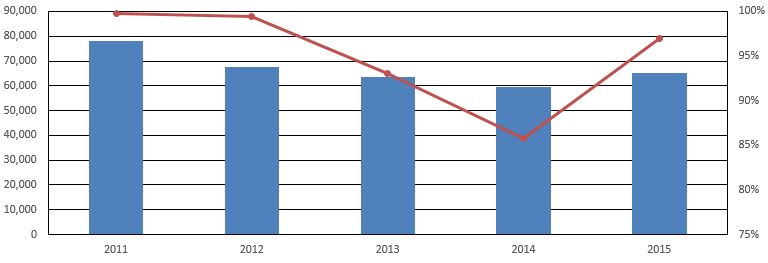
The left value axis we want to have a count with a bar chart.
The right value axis we want to show a percentage with a line chart.
Thank you