Hi,
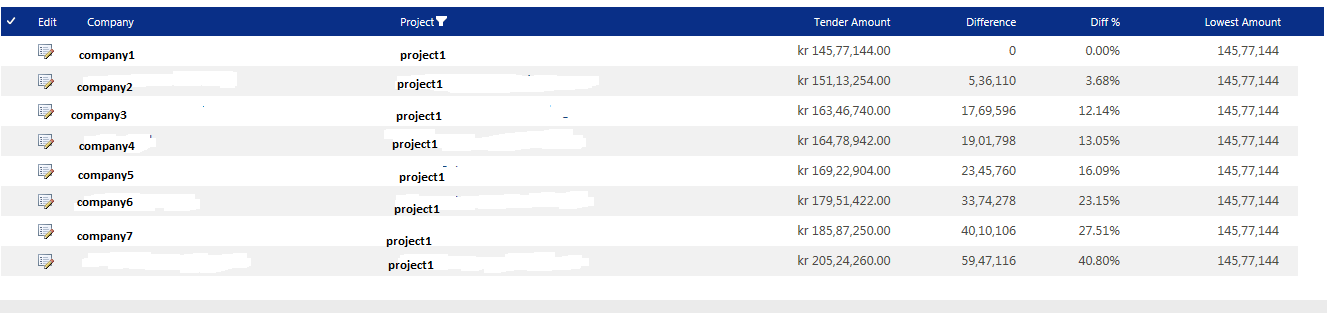
I have a root list, in which I can select a tender amount of a company against a project. I had also a calculated field in this list whoch displays the percentage difference of different companies
tender amount against a project. Diff% will be zero for the lowest tender amount and other tenser amounts acompared to this lowest tender amount.
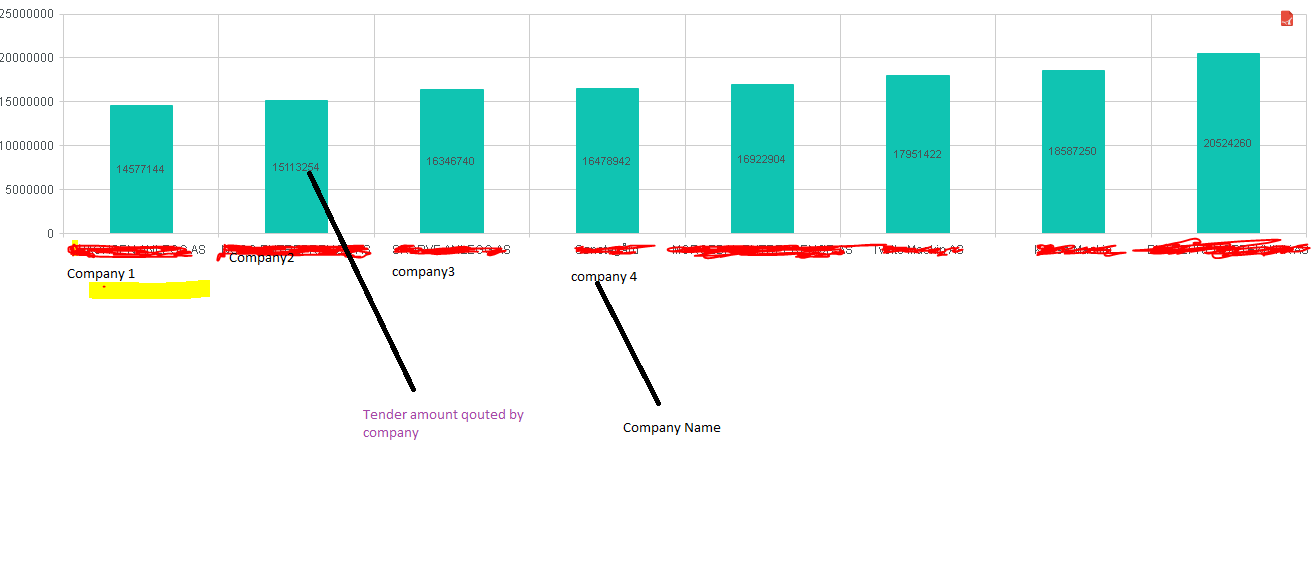
Every subsite's of my project has an spchart which lists all the tender amount quoted agains this project.
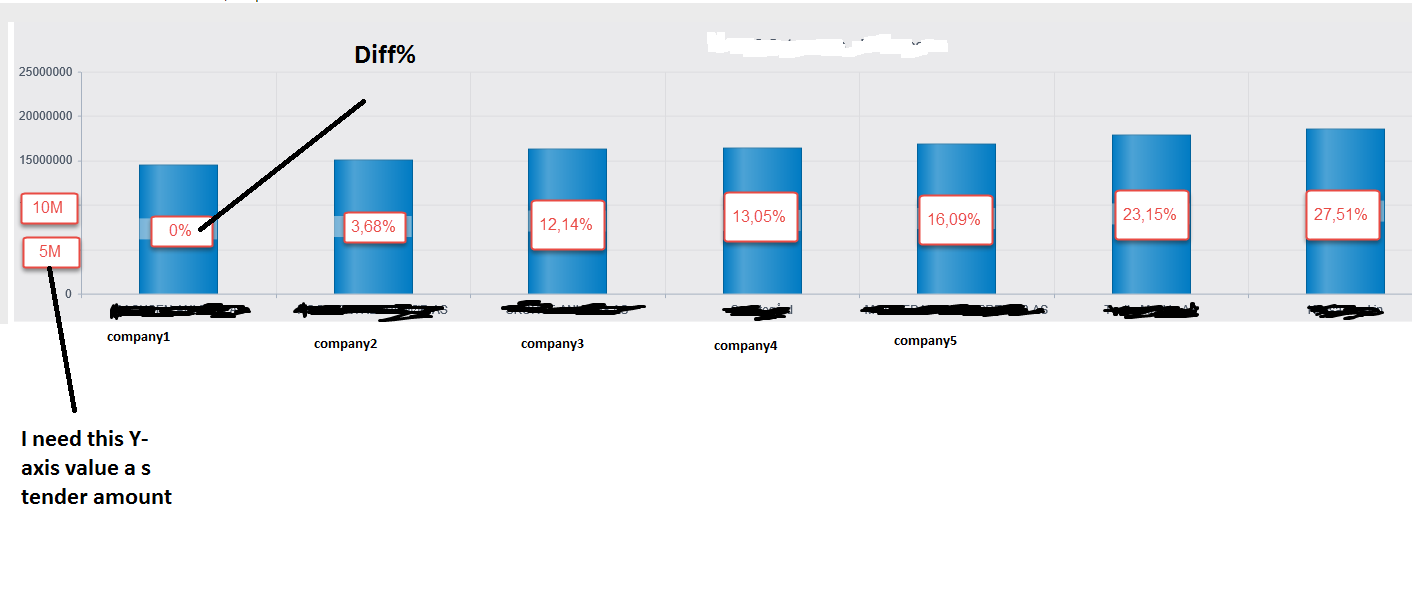
I need to display the Y axis as tender amount and x axis as company and the graph shows the diff %
Pls refer the sceenshots
Thank You the below codes working
Hi Liju,
Please, go to Dashboard -> Style -> Labels and put the code into ‘template’ property:
#=dataItem[‘FieldName’]#%
Replace ‘FieldName’ with the internal name of the ‘Diff %’ field, which you can find say, in CAML-query (in Data Source -> SharePoint List).
Thank You alex
Hi,
One more thing. How can I show the Y-Axis(Value Axis) value in Millions? How can i split this? Actually the real value is 5000000. I need to show it as 5M.
No problem got that too from another thread. I used this codes
window.FormatLongNumber = function(value) {
if(value == 0) {
return 0;
}
else
{
// hundreds
if(value <= 999){
return value;
}
// thousands
else if(value >= 1000 && value <= 999999){
return (value / 1000) + ‘K’;
}
// millions
else if(value >= 1000000 && value <= 999999999){
return (value / 1000000) + ‘M’;
}
// billions
else if(value >= 1000000000 && value <= 999999999999){
return (value / 1000000000) + ‘B’;
}
else
return value;
}
}
Then, set the template property of the appropriate axis in:
#= FormatLongNumber(value) #
Thread is Change value axis format to read in millions
В In a line graph, I get a gap between the Y-Axis and the start of the line, and a gap between the end of the line and the rightmost vertical border of the graph the inner border. How can I eliminate these gaps?
Hi,
Please, insert the following line into handlers.preRender handler in Dashboard -> Advanced tab.
config.categoryAxis.justified = true;