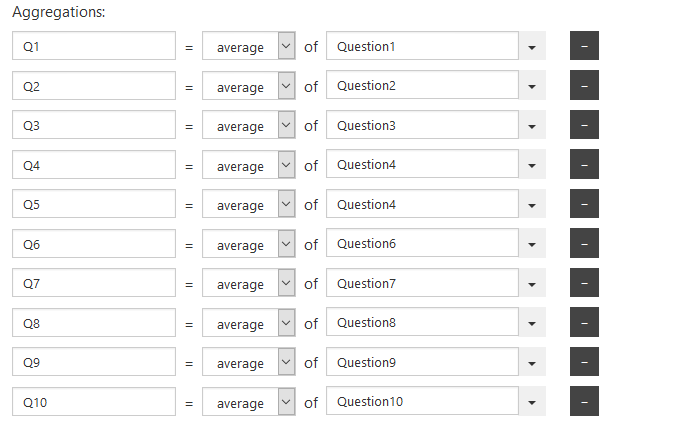
I am trying to use the current list source to pick all the columns that contain "Question" and apply them as aggregate options dynamically. Is this possible? or if there is a better way let me know!
for instance:
This list has 60+ questions and I do not want to add each question as an aggregate manually.
Dear Rift,
You can try to aggregate the items dynamically with JavaScript in Advanced section, though this can be tricky as well. The items are separated into groups, but you can do it manually as well, so the data contains both the items, and the groups with the correct value. This would require knowledge and skill in JavaScript though.
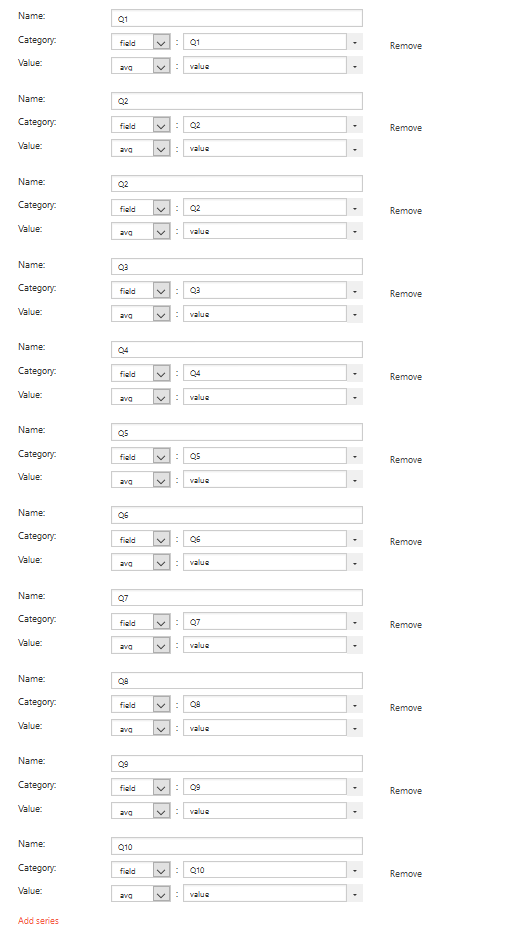
As for displaying each one, there is an option to Display each group as a separate series, you can use it instead of manually adding each question.
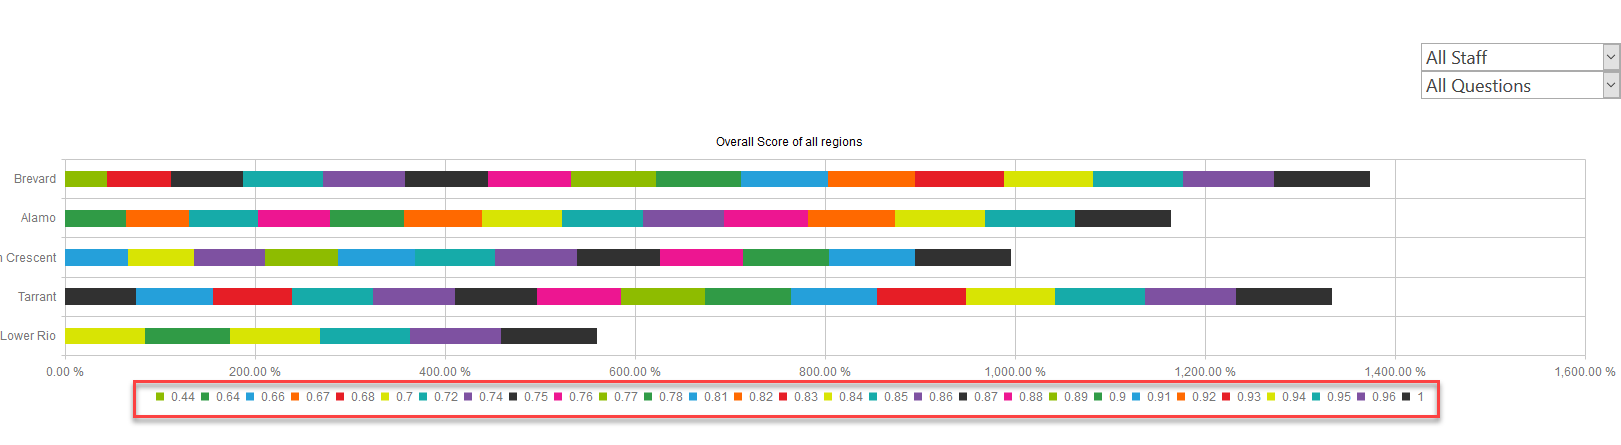
Thanks for your response. I don't have a problem with JavaScript, I was more looking for an example to see how it could be done. I looked for examples on dynamically aggregate but couldn't find any. I am using the display each group as separate series now but it brings back their values and not the question title.
I was able to fix the CAML query based on graph clicks and select on change events and now I need to figure out how to aggregate all the columns with questions dynamically. Do you happen to have an example of how to do that?
Finally, you can always retrieve the data after it is processed in the Dashboard’s Designer’s own console and check out the data property - it contains both items and groups. You’ll need to see how the groups are formed, and what information they contain. Then, you can manually build groups inside of events in the Advanced section, even manually replace all the existing ones with the ones you need. These are JavaScript objects, and you can loop through items and separate them into groups.