Hello. I'm having issues applying the Drill-Down link to a SharePoint list functionality. I followed the instructions in the http://www.spchart.com/documentation/link-chart-to-list link but have been unable to get it right. After applying the code, clicking on the chart will reset any filters I have manually applied to the list view, but clicking on a series in the chart will not apply the filter programmatically. I was attempting to use the ctx variable since my page only contains one view and I only need one column filtered.
Here's the code:
[code]var handlers = {};
handlers.preRender = function (config, logger) {
logger.debug('Configuration: ', config);
var filtrationApplied = false;

config.plotAreaClick = function (e) {
    if (!filtrationApplied) {
        window.location.hash = '';
    }

    filtrationApplied = false;
}

config.seriesClick = function (e) {
    if (ctx && ctx.clvp) {
        var filter =
          'FilterField1=Overall-FilterValue1=' + e.dataItem.Overall;

        window.location.hash = 'InplviewHash' +
        ctx.clvp.wpid + '=' + encodeURIComponent(filter);

        filtrationApplied = true;
    }
}

return true;
}
[/code]
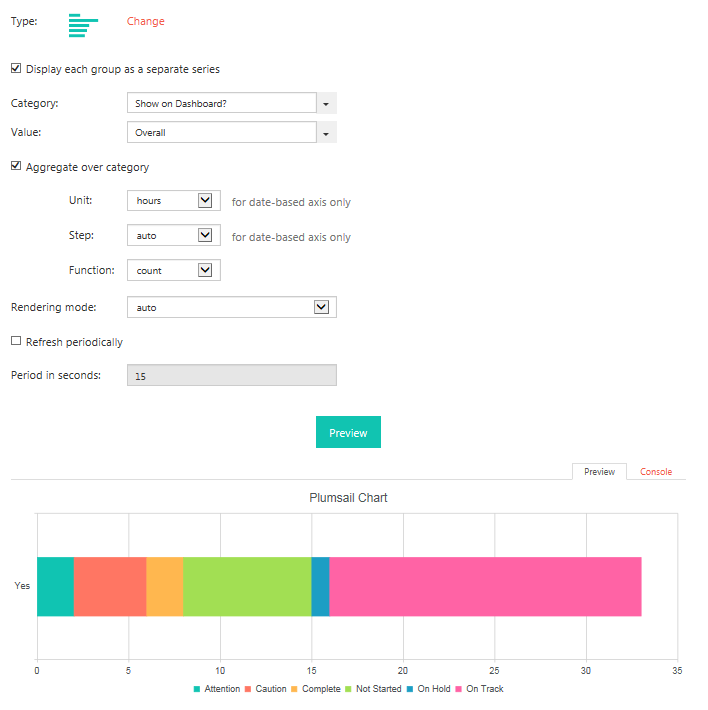
I've attached a screenshot of the setup.
Thank you for your help.
Hi,
First, ensure that the ‘Overall’ is the correct internal name of the field.
What happens when you click the series? Does the URL of the current page change? Could you provide the complete URL after clicking the series?
I’m sure Overall is the correct internal name. Here is the last part of the URL for the field:
…2D0929E9E97D63%7D&Field=Overall
It may be worth noting that the field I am attempting to filter on is a Lookup column.
After the page loads, if I click on any series nothing happens. If I manually apply a filter to the view and then click on any series, the filtration is reset. If I manually apply a filter to the view and then click anywhere in the chart area, nothing happens.
Page Load:
healthcare.sharepoint.com/sites … tePages/DA²%20Projects%20Dashboard.aspx
After “Attention” series click:
healthcare.sharepoint.com/sites … tePages/DA²%20Projects%20Dashboard.aspx#InplviewHashf207eb42-4e1b-47fd-aee2-2d082a1a39e1=FilterField1%3DOverall-FilterValue1%3D2
After manual filer applied:
healthcare.sharepoint.com/sites … tePages/DA²%20Projects%20Dashboard.aspx#InplviewHashc8f9348a-0815-47c7-b144-083c42c132c7=FilterField1%3DOverall-FilterValue1%3DAttention
First, as I can see, you're using incorrect view Id, it seems you have multiple view on the page. Try to replace ctx.clvp.wpid in your code with 'c8f9348a-0815-47c7-b144-083c42c132c7':
var handlers = {};
handlers.preRender = function (config, logger) {
    logger.debug('Configuration: ', config);

    var filtrationApplied = false;

    config.plotAreaClick = function (e) {
        if (!filtrationApplied) {
            window.location.hash = '';
        }

        filtrationApplied = false;
    }

    config.seriesClick = function (e) {
        var filter =
          'FilterField1=Overall-FilterValue1=' + e.dataItem.Overall;

        window.location.hash = 'InplviewHashc8f9348a-0815-47c7-b144-083c42c132c7=' + encodeURIComponent(filter);

        filtrationApplied = true;
    }

    return true;
}
And second 'Overall' field contains lookup Id whereas you need a lookup value. I believe that the value is stored in another property on the e.dataItem object.
We can implement the case for you, it will take 100 support minutes. If it suits you, please, pay for the minutes in our store:
https://plumsail.com/sharepoint-dashboard-designer/store/#!/100-minutes/p/17765967/category=11274284
Then export the chart (Export button in Dashboard Designer), save the list as template with data (List settings -> Save list as template -> tick Include Content) and send them to support@spchart.com.
I was able to solve it. Instead of e.dataItem.Overall in the config.seriesClick, I just used e.category which set the text of the field for the value in the URL as opposed to the ID of the lookup. Once I set the proper web part ID the whole thing worked great. One item of note is that the plotAreaClick did not seem to work in a pie chart. I applied this same code to a column chart and it functioned as expected.
I also have more of an enhancement question: Is there a way to have the page scroll back to the top after the seriesClick? Our list is long by default and when a user clicks the chart to filter, the page stays put (at the bottom) and it gives the illusion that every thing disappeared until they try scrolling up. I tried a few posted JS solutions from the web with no success.
Thanks again!
Here’s the final code:
[code]var handlers = {};
handlers.preRender = function (config, logger) {
logger.debug('Configuration: ', config);
var filtrationApplied = false;

config.plotAreaClick = function (e) {
    if (!filtrationApplied) {
        window.location.hash = '';
    }

    filtrationApplied = false;
}

config.seriesClick = function (e) {
    var filter =
      'FilterField1=Overall-FilterValue1=' + e.category;

    window.location.hash = 'InplviewHashc8f9348a-0815-47c7-b144-083c42c132c7=' + encodeURIComponent(filter);

    filtrationApplied = true;
}


return true;
}[/code]
Hi,
Please, try the code below to scroll to the top of the page:
window.scrollTo(0, 0)