Hi
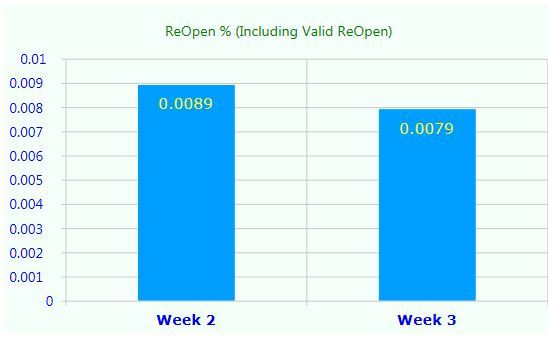
I use plumsail chart showing the decimal value as 0.79 and 0.89 which is entered in the list item. But when I see it in the plumsail chart it shows as 0.079 and 0.089 . Also the y axis labels shows as
0.001 to 0.01 …I want the y axis label values to start from bottom 0.1 , 0.2 upto 1.0 to the top.
and the y axis values to be shown as 0.79 and 0.89 as values. Because I entered the list item value as 0.89 and 0.79 only. but it shows in the graph as 0.079 and 0.089 respectively. how do I rectify this ?