Hey Guys,
I want to create an Chart where all List items are listed seperately on the y axis. Each Item has two Date values and this range should be displayed along the x axis. Like this:
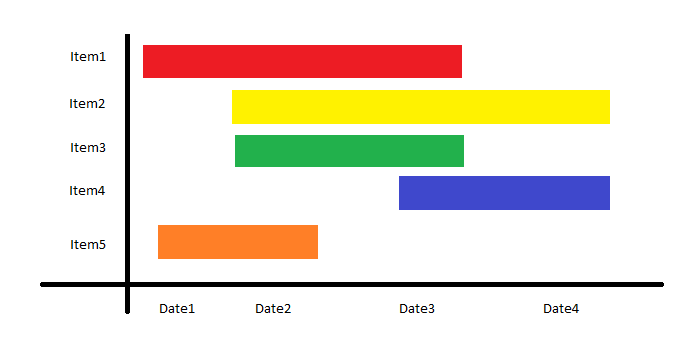
Is something like that possible? I tried using the range Chart but don't seem to get it working.