Hello!
In Plumsail Forms I used the Likert Scale control and saved the data in SharePoint list in a plaintext multiline field. How do I now build charts based on this field using Plumsail Dashboard Designer? Is there a simpler solution or the only solution is with JavaScript to parse text in this field and create artificial columns and items based on which to build charts?
Thanks
Dear @Cumatale,
That's a good question! Unfortunately, the answer is yes, it's only possible with JavaScript. Dashboard Designer app is quite old at this point, it was released a long time ago when even the Modern UI wasn't a thing. DataTable control and Forms are much fresher, and do things differently.
We didn't have enough time yet to make sure the two work together out of the box, so right now the only option is to parse these columns and create items based on them for DD to render as charts.
Thank you,
I know how to create new data columns in data.items, but how can I create new items?
I used code below:
var stringLikert=""
var arrayLikert=[]
handlers.requestSuccess = function(data, logger) {
//number or existing sharepointlist items
var nrItems=data.items.length;
for (var i=0; i<nrItems; i++) {
//Copy text from SharePoint List Item
stringLikert = data.items[i]._x0071_4;
//remove []
stringLikert=stringLikert.substr(1,stringLikert.length-2)
//remove all " simbols
stringLikert=stringLikert.replace(/"/g,"");
//split the string in array
arrayLikert=stringLikert.split(",");
//create artificial coloumn and items based on arrayLikert
var nrArray=arrayLikert.length;
for (var j=0; j<nrArray;j++) {
data.items[nrItems+i * nrArray+j].Category="Cat"+j;
data.items[nrItems+i * nrArray+j].categValue=arrayLikert[j];
}//for j
}//for i
return true;
}
but it doesn't work because it exceeds the number of items in the list:
13:05:08 ERROR - Request failed: TypeError: Cannot set property 'Category' of undefined
Thank you!
I found it myself, thank you
1 Like
Dear @Cumatale,
Sorry about that  Still didn't have enough time to test it yet, so I'm really happy to hear that you've figured it out!
Would you be so kind as to maybe share some of the code in a post here? I'm sure other users might find it very useful in the future. Of course, it's up to you, I'm just happy that you did find a way 
My task is to reflect the results of a survey in which all questions have the same set of answer options.
Here is the code I use, I hope it will be useful to other users:
//define the name of categories that are in Form in Likert Scale control, but are not stored in sharepoint list in multiline plaintext field
var arrayCategorii=["Ușurința","Amabilitatea","Claritatea","Disponibilitatea","Timpul","Prețurile","Reducerea","Varietatea","Transparenta","Managementul"]
var nrArray=arrayCategorii.length;
var categorii = [];
handlers.requestSuccess = function(data, logger) {
var stringLikert=""
var arrayLikert=[]
 if (data.items.length>0) {
  var nrItems=data.items.length;
  var contor=nrItems-1;
  for (var i=0; i<nrItems; i++) {
		//Copy text from SharePoint List Item
    stringLikert = data.items[i]._x0071_4;
    //remove []
    stringLikert=stringLikert.substr(1,stringLikert.length-2)
    //remove all " simbols
    stringLikert=stringLikert.replace(/\"/g,"");
    //split the string in array
    arrayLikert=stringLikert.split(",");
    //create artificial coloumn and items based on arrayLikert
       itemObiect= data.items[i];
    for (var j=0; j<nrArray;j++) {
       var itemObiect = JSON.parse(JSON.stringify(data.items[i]));
 		   		itemObiect.Valoare=arrayLikert[j];
 				 	itemObiect.Categorie=arrayCategorii[j];
 			    data.items.push(itemObiect)
    }//for j
  }//for i
     //remove initial items
  for (var i=0; i<nrItems;i++){data.items.shift()}
 }//if length>0
 //generate table of unique categories (for sorting in handlers.aggregationSuccess)
  for(var i = 0; i < data.items.length; i++){
        categorii.push(data.items[i].Categorie);
    }
    var unique = categorii.filter(function(itm, i, categorii){
        return i == categorii.indexOf(itm);
    });
    categorii = unique;
   return true;
}

handlers.requestError = function(error, logger) {
  return $.Deferred().reject(error);
}

handlers.aggregationSuccess = function(data, logger) {
  //clone all posible categories in firs data group. Put null to Value column to not denaturate result in chart
  for(var i = 0; i < categorii.length; i++){
        var clone = $.extend({}, data.groups[0].items[0]);
        clone.Valoare = null;
        clone.Categorie = categorii[i];
        data.groups[0].items.push(clone);
    }
  //sort the items in data-group[0] by categories
      data.groups[0].items.sort(function(a, b) {
        if ( arrayCategorii.indexOf(a.Categorie) > arrayCategorii.indexOf(b.Categorie) )
        return 1;
        if ( arrayCategorii.indexOf(a.Categorie) < arrayCategorii.indexOf(b.Categorie) )
        return -1;
        return 0;
    });
    return true;
}
My next task is to reflect the results not in numbers, but as a percentage of the total number of values in each category (see image).
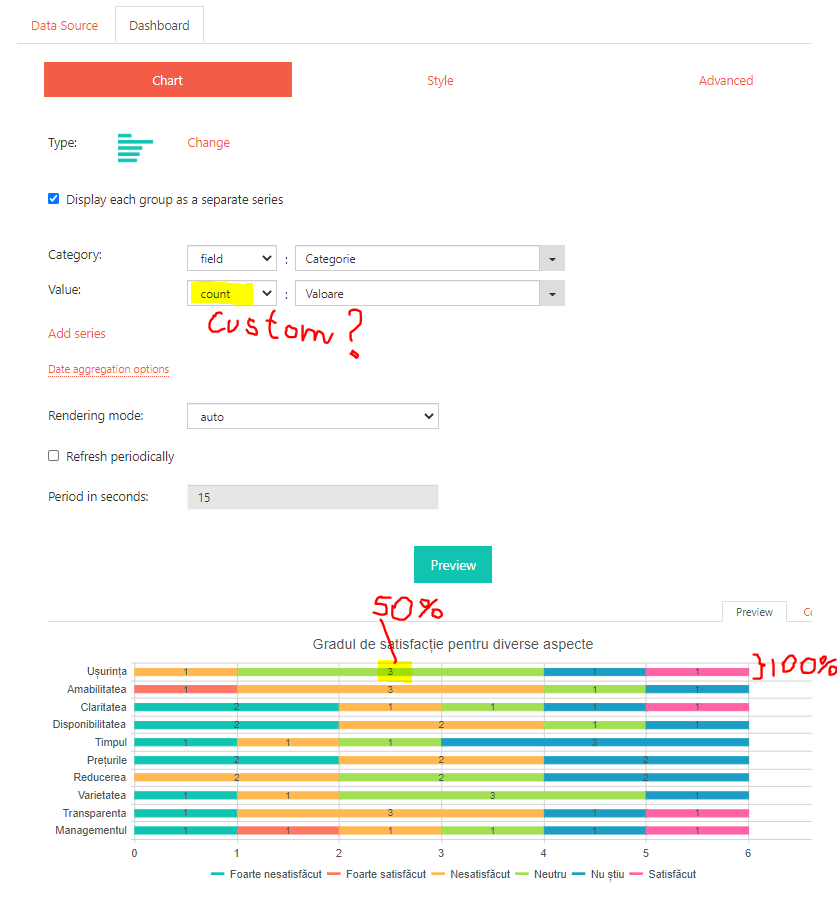
Because the values are not numeric, but of the enumerative type, I suspect that there is a need to define a new type of Custom grouping, but I did not find in the documentation how to do this. I would be grateful for a suggestion. Thanks
1 Like