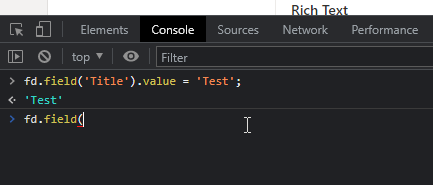
How can I debug my JS code in Forms Designer through browser's console/Chrome DevTools to follow the code step by step
Dear @himansh,
The easiest option to debug code is to run it directly from browser's console. First, you need to add variables that you want to work with to the global window, with the following lines in JS editor:
window.fd = fd;
window.$ = $;
window.pnp = pnp;
Then, run any code pieces in browser's console without any problems. The only issue is that you won't be able to run them inside the events, the form will already be loaded. Most of the time, you can just wrap the code after testing inside fd.spRendered() event and add ready events for the complex fields that need to load, and you'll be good.
If you absolutely have to debug code from JS editor, the debugger does work - Debugging Custom JS
You simply need to open the console, before opening a form, and it will auto-activate. The problem is that you'll also go line after line via our code as well, and it's not readable.
Hi @Nikita_Kurguzov,
Can you show a working example of how to debug code? I just need to see how it works so I can start using this.
I really appreciate the support you guys offer. ![]()
Dear @Qman,
You just add these lines of code to the JS editor, then, you can open the form in the browser, and run any commands from console to test how they work:

No need to use fd.spRendered() and such as the form is already rendered when you open the console.
Right okay.
Correct me if I'm wrong.
-
Put these codes in Plumsail designer JS Editor:
window.fd = fd;
window.$ = $;
window.pnp = pnp; -
Take the code you want to test from JS Form designer and put it inside the browsers Console.
Dear @Qman,
Yes, you're correct - these lines make them available in the browser's console. Then, you can run any code and test how it runs.