How to create chart for current logged-in user in SP2013

Dear Team,

I need show orgchart from SharePoint list for current logged-in user. In my list,about 150 items and having a columns “Login Id”,“Name” and “Department” . Once page gets load, want to show current logged-in user’s department chart by comparing logged-in user-id with “Login ID”. Can you please post any sample regarding this scenario asap?

Thanks in advance!

Hi Sam,

Thank you for your question.

You can do it using our JavaScript framework and JSOM. Let us say you have “LoginId” field in your list which stores login for user. Thus you can use it to find list item in list by current user. Below you can find sample JavaScript which requests list item from list for Org Chart by current user and then drills down to it.

This script will work if you store data in “LoginId” field as plain text like this “domain\userlogin”. If you have different internal name for field where login is stored just find “loginFieldInternalName” variable in the script and specify your own internal name for field like this:

var loginFieldInternalName = "LoginId";

Here is complete script. Just replace “loginFieldInternalName” if required and paste it into JavaScript editor of the configuration wizard.

[code]function getCurrentUserOrgChartId(completed){

var camlQueryTemplate = “{{currentUserLogin}}”;
var listId = renderer.config.ListDataSourceSettings.ListId;
var orgChartIdFieldName = renderer.config.idFieldMapping.InternalFieldName;

var context = SP.ClientContext.get_current();
var web = context.get_web();
var currentUser = web.get_currentUser();
context.load(currentUser);

context.executeQueryAsync(function () {
var currentUserLogin = currentUser.get_loginName();
var originalLogin = currentUserLogin.replace(/.*|/, “”);

console.log(originalLogin);

var list = context.get_web().get_lists().getById(listId);
var camlQuery = new SP.CamlQuery();
var queryText = camlQueryTemplate
                    .replace("{{loginFieldInternalName}}", loginFieldInternalName)
                    .replace("{{currentUserLogin}}", originalLogin);
camlQuery.set_viewXml(queryText);
var foundItems = list.getItems(camlQuery);
context.load(foundItems);

context.executeQueryAsync(function () {
    console.log(foundItems);
    f = foundItems;
    var en = foundItems.getEnumerator();
    if(en.moveNext()){
      var fieldValuesForCurrentUser = en.get_current().get_fieldValues();        
      var currentUserOrgChartId = fieldValuesForCurrentUser[orgChartIdFieldName];          
      completed(currentUserOrgChartId);
    } else {
      console.log("List item for current user not found.");
    }
          
});

})

}

var loginFieldInternalName = “LoginId”;
var isFirstLoad = true;
var currentUserOrgChartId = “”;

getCurrentUserOrgChartId(function(userId){
currentUserOrgChartId = userId;
});

renderer.onLoadingFinished(function(){

if(isFirstLoad){

isFirstLoad = false;
  
if(currentUserOrgChartId){
  renderer.drillDown(currentUserOrgChartId);  
}

}

});[/code]

The script has two parts. The first is “getCurrentUserOrgChartId” function which is responsible for querying your SharePoint list by current user. And the second is actual drilling down to the user. I will pay more attention to this. Here is this part of script:

[code]var loginFieldInternalName = “LoginId”;
var isFirstLoad = true;
var currentUserOrgChartId = “”;

getCurrentUserOrgChartId(function(userId){
currentUserOrgChartId = userId;
});

renderer.onLoadingFinished(function(){

if(isFirstLoad){

isFirstLoad = false;
  
if(currentUserOrgChartId){
  renderer.drillDown(currentUserOrgChartId);  
}

}

});[/code]

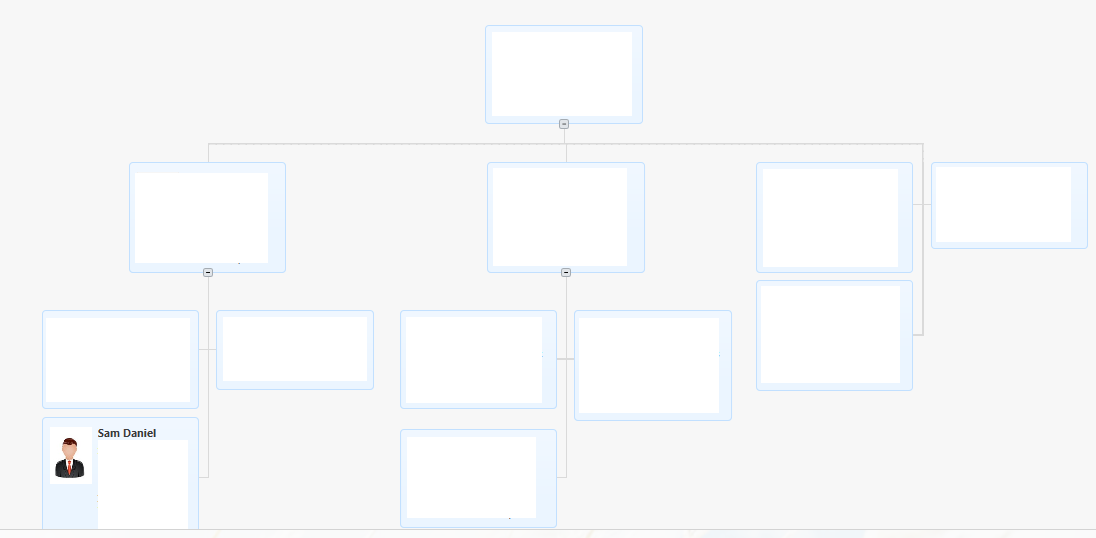
As you see it just requests list item for current user using “getCurrentUserOrgChartId” funciton and then waits for Org Chart loaded event. Inside this event it drills down to the user.

Dear Anton,

Your sample working fine but shows only current logged-in user and user has to expand to see parents. But my requirement is to show current user’s full department structure with all child should be expanded mode.

And parent of HOD should be hidden, expanding on user wish. How to fix this?
Thanks for your understanding!

Hi Sam,

As I understood you want to look at “Department” field of current user. Then find manager of this department. Once you have it you want to set it as root of current Org Chart. Then expand all nodes inside this department. Is it correct?

I can suggest you to use prerenderAction function from our JavaScript framework. This function allows you to do some work before rendering Org Chart. You can use JSOM and CAML to query information from list.

For example you can create separate list where you store all managers of all departments. Then inside prerenderAction you can query this list according to information from current user. Query manager from list where Department is equals to department of current user. Once you received manager you can override config property of Org Chart like this:

renderer.config.RootNodeId = "Your custom root ID".

You can use any other logic to receive root id, but then use it to overrid config.RootNodeId.

Thus, you can dynamically change root ID of Org Chart.

Another aspect of your task is to exclude employees from other departments from Org Chart. To do this you also can dynamically specify filtration rule or Org Chart like this:

renderer.config.FiltrationRule = "function(itemData){ your custom rule here }";

You can find example of filtration rule here.

Dear Anton,

Your suggestion worked! I passed HOD Id dynamically " renderer.drillDown(hodid);". Now Chart shows current users department structure. But It shows only two level of tree, further levels are collapsed. Actually my tree has 4 levels, I need to show all 4 level in expanded mode when chart loads. How to achieve this? Thanks in advance!

Hi sam,

Thank you for your question.

You can use ‘expandNodeLevels’ function to expand specified number of org chart levels. You can use it together with ‘showLoadingPanel’ and ‘hideLoadingPanel’ functions. Show loading panel before calling the function and hide it inside ‘completed’ callback function.

Example:

renderer.showLoadingPanel(); renderer.expandNodeLevels(4, function(){ renderer.hideLoadingPanel(); });
See additional information in the documentation for JavaScript framework.

I tried by add this code to custom javascript wizard to expand all level but no luck!

renderer.showLoadingPanel(); renderer.expandNodeLevels(4, function(){ renderer.hideLoadingPanel(); });

Here is the actual chart:


And Expected like this:


Am I missing somewhere or Is there any other way to achieve this? Thanks

Hi Sam,

You need to execute ‘expandNodeLevels’ inside callback function of ‘drillDown’ function. Thus you can ensure that nodes are expanded right after drill down is executed.

Example:

[code]renderer.drillDown(hodid, function(){

renderer.showLoadingPanel();
renderer.expandNodeLevels(4, function(){
renderer.hideLoadingPanel();
});

});[/code]

Where hodid is your id.

Thank you very much Anton, Its working now.
I just add those code here:

[code]renderer.onLoadingFinished(function(){
renderer.expandNodeLevels(4, function(){

});
if(isFirstLoad){

isFirstLoad = false;
  
if(currentUserOrgChartId){
  
  renderer.drillDown(hodid1);
  
}

}

});[/code]

For your case this is also an option.

Note. You code inside onLoadingFinished will be executed each time after loading panel is appeared. I guess it is normal for your case, but you need to know.