Hello,
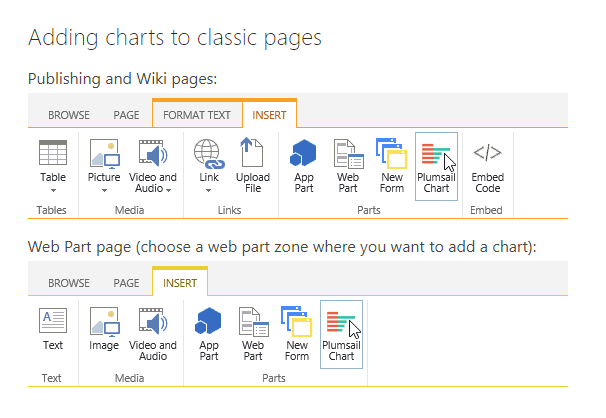
I was following these instructions:
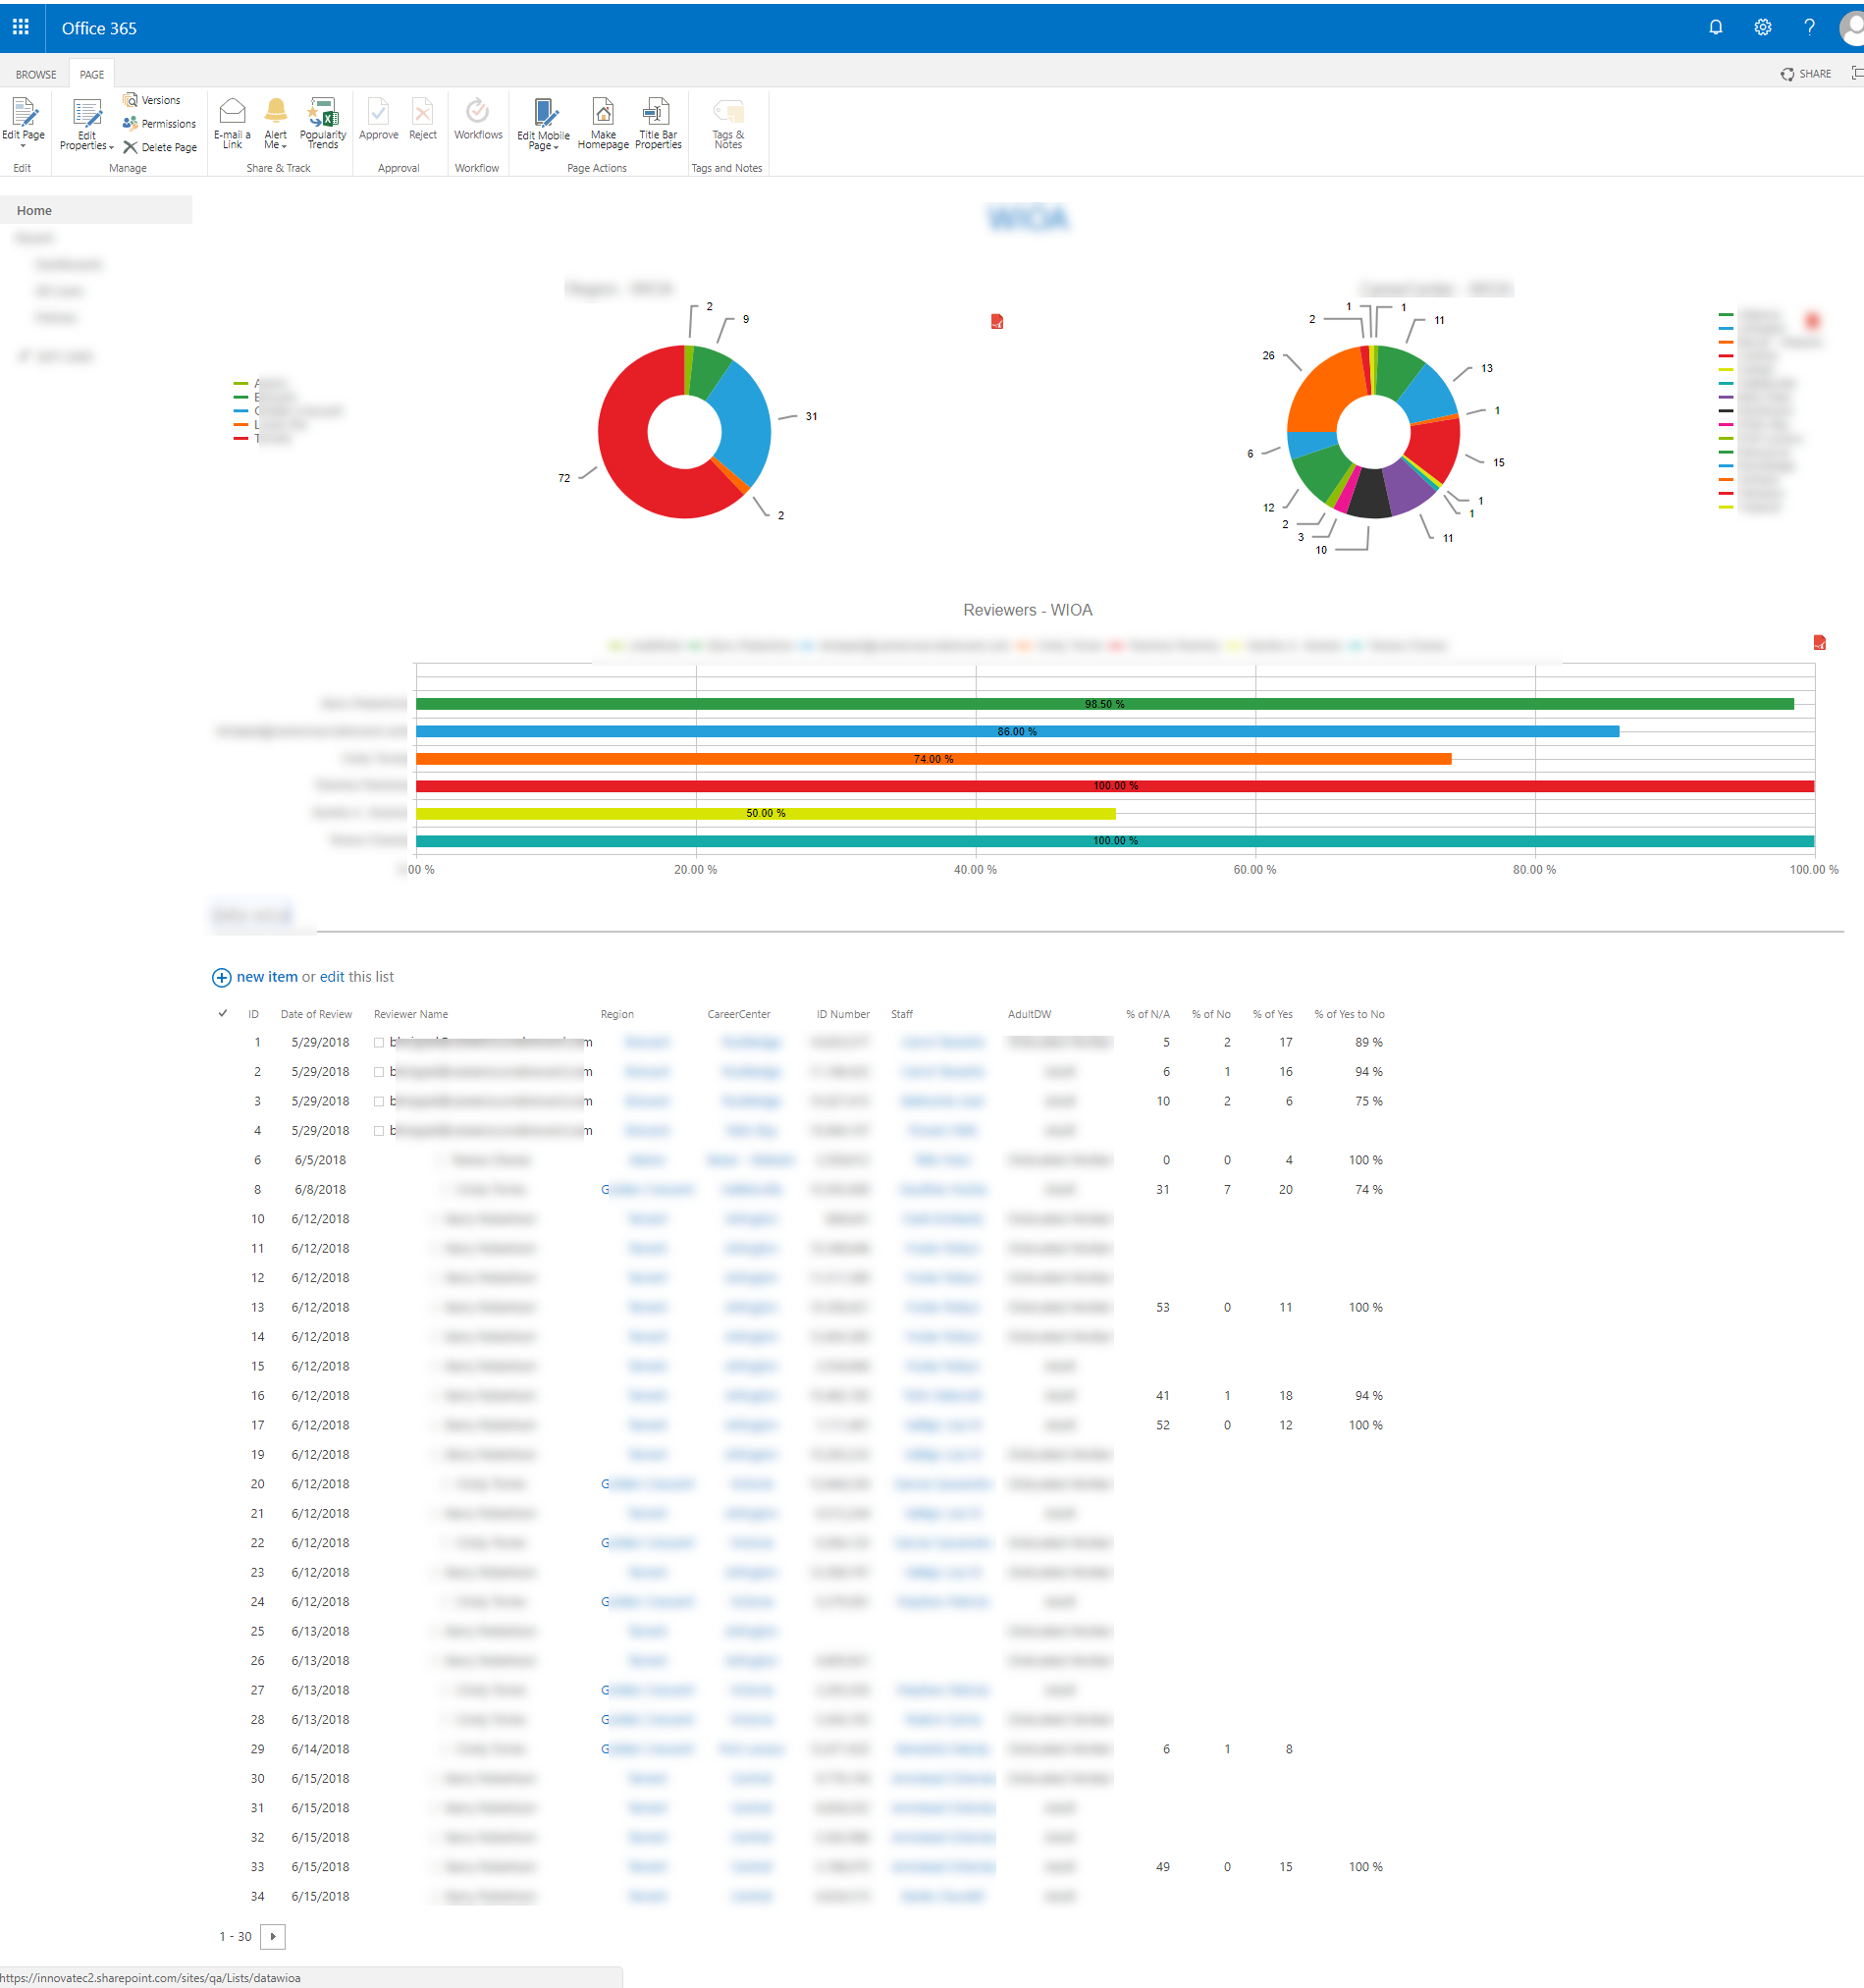
I was trying to do the same configuration as described on the guide but I was not able to get it to work. Instructions are not clear on all the steps to configure the graph correctly. I am using O365 I tries this on modern and classic experience with no luck.
In the guide it states "Under the chart I put the list of issues" but it doesn't say how, which steps were taken. Lots of confusion to how you can add the list. There is also multiple ways you can add a list to a page.
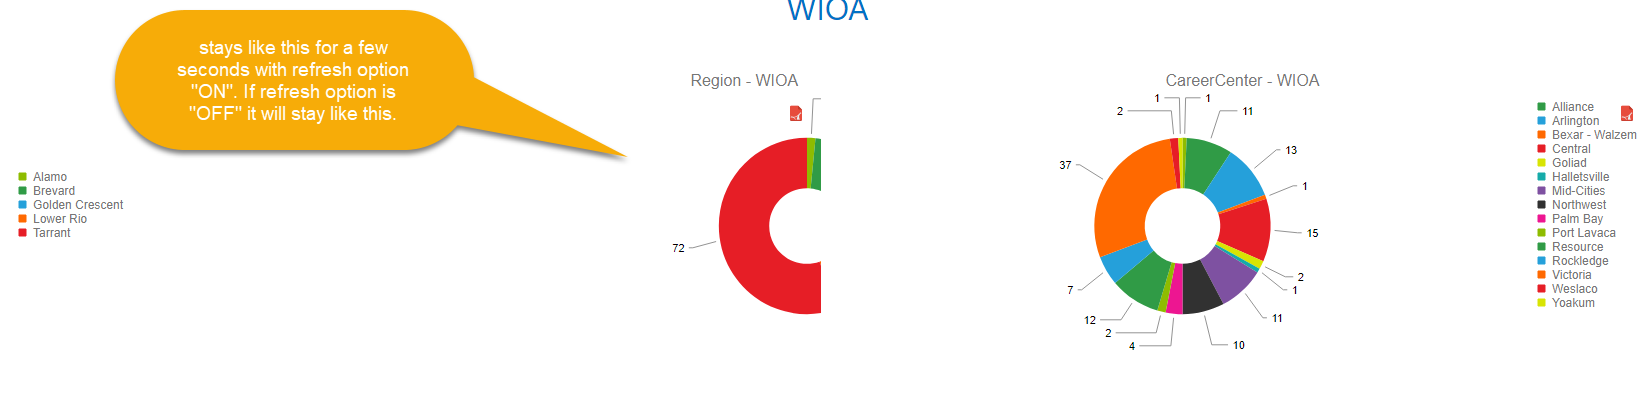
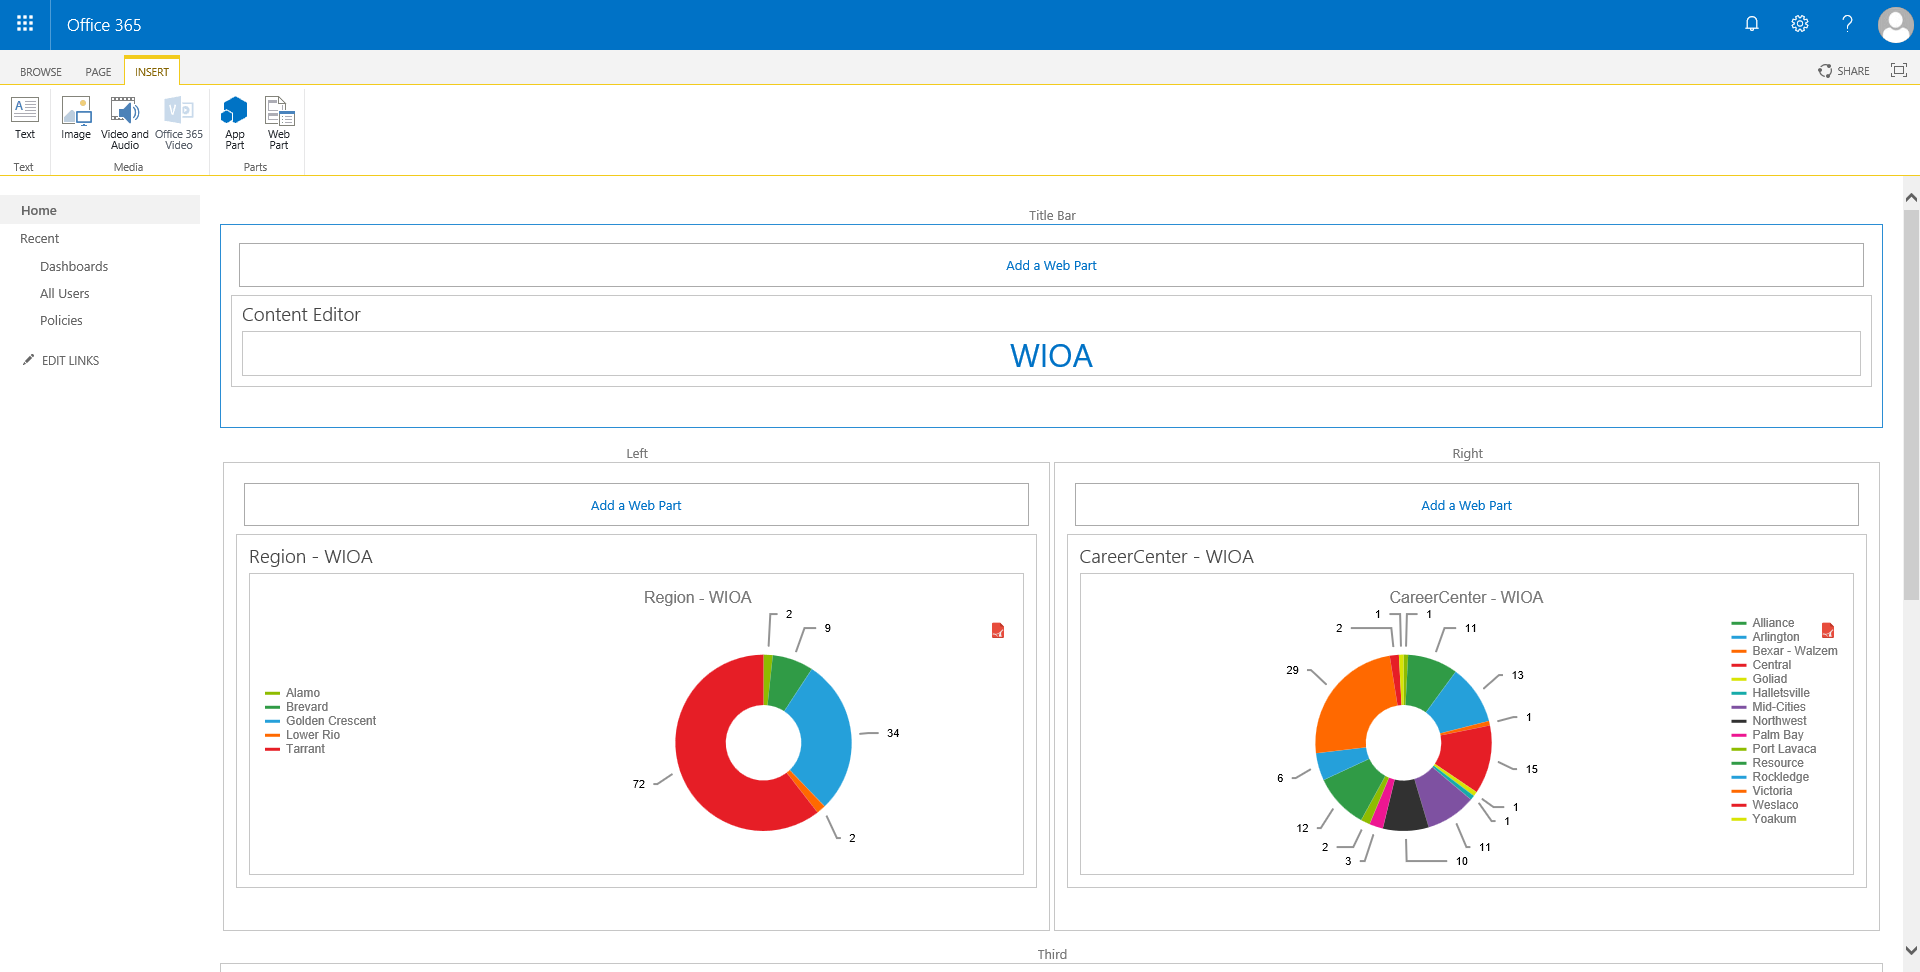
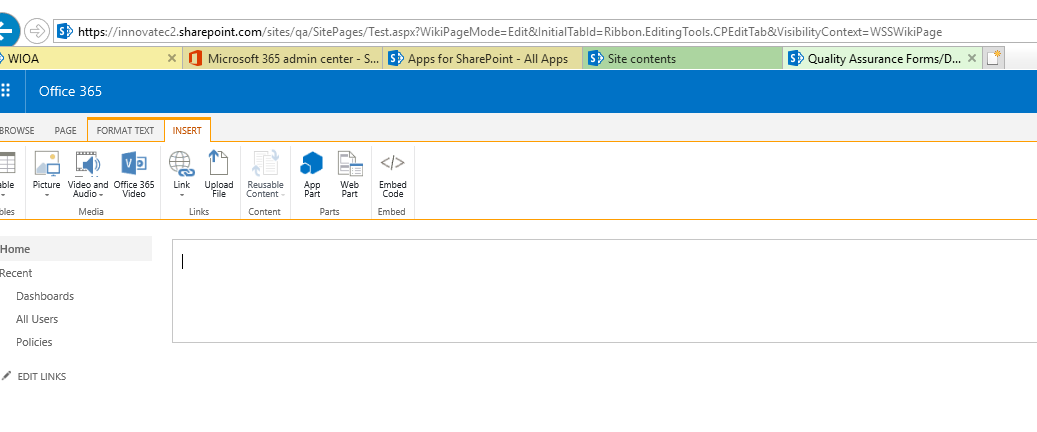
The way I'm trying to get this to work is by adding my graphs to a web-part aspx page and adding the list at the bottom. I am not using the actual list page and adding the dashboard on top. There is also multiple configurations to the actual list webpart that could be changed these are not really specified.
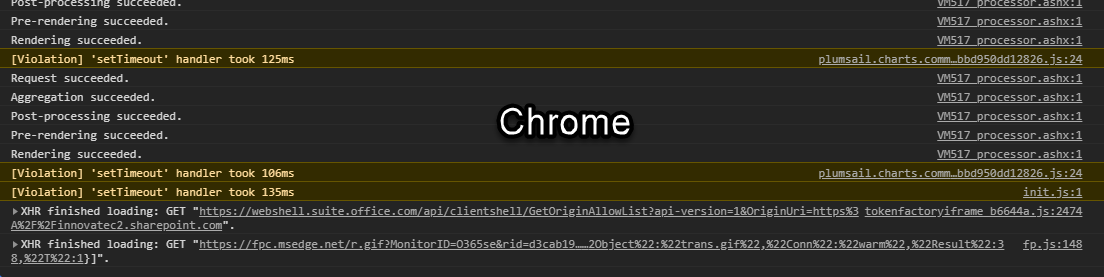
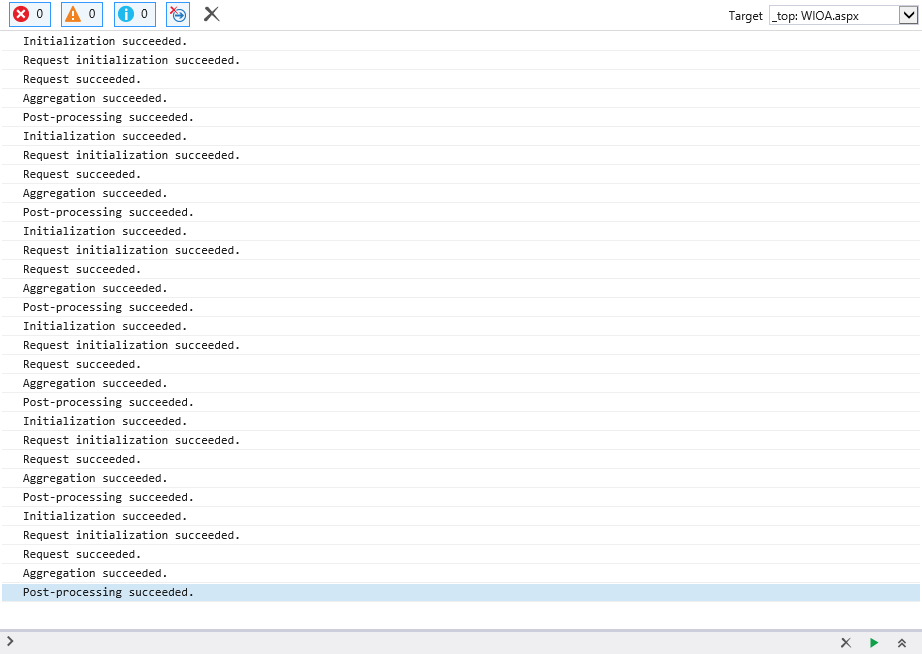
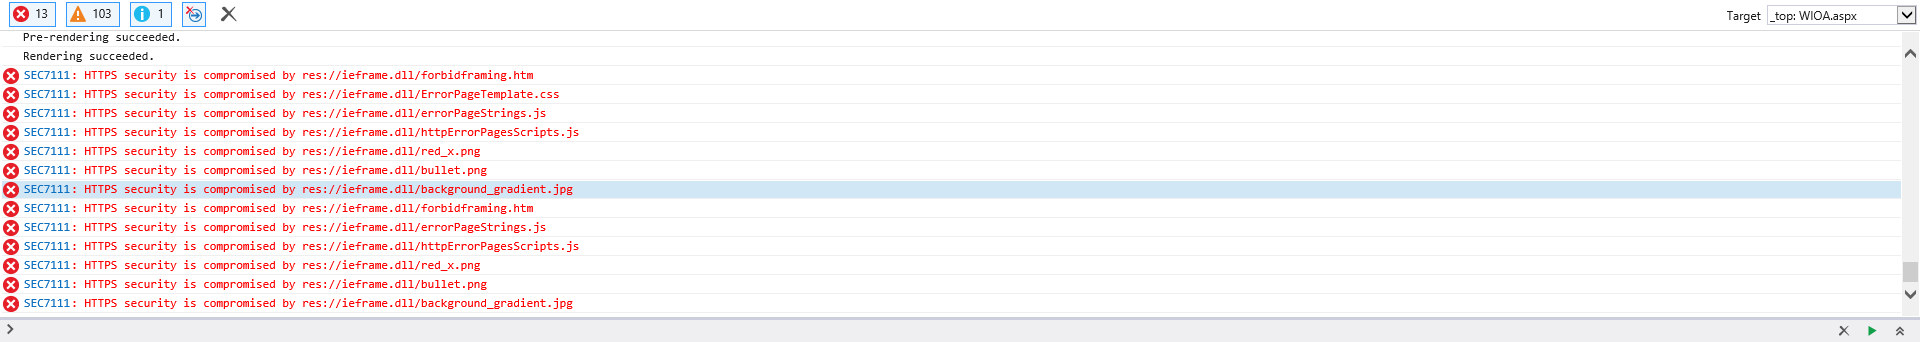
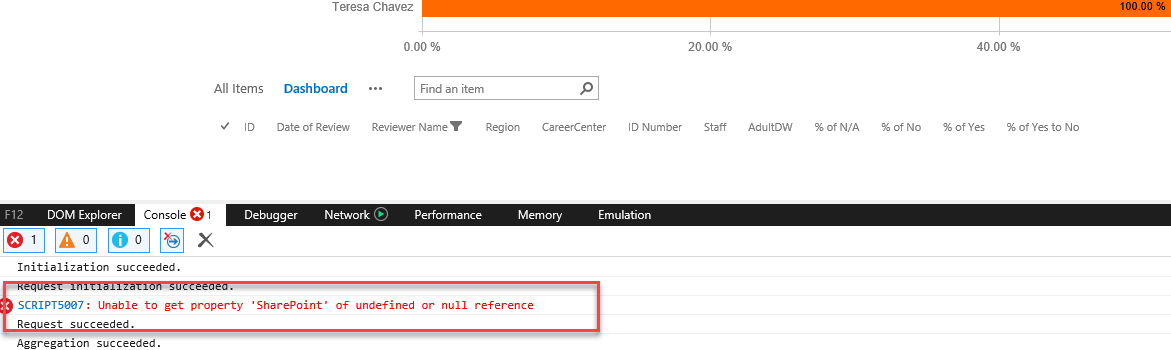
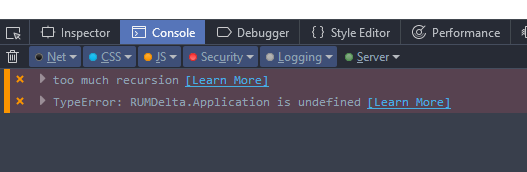
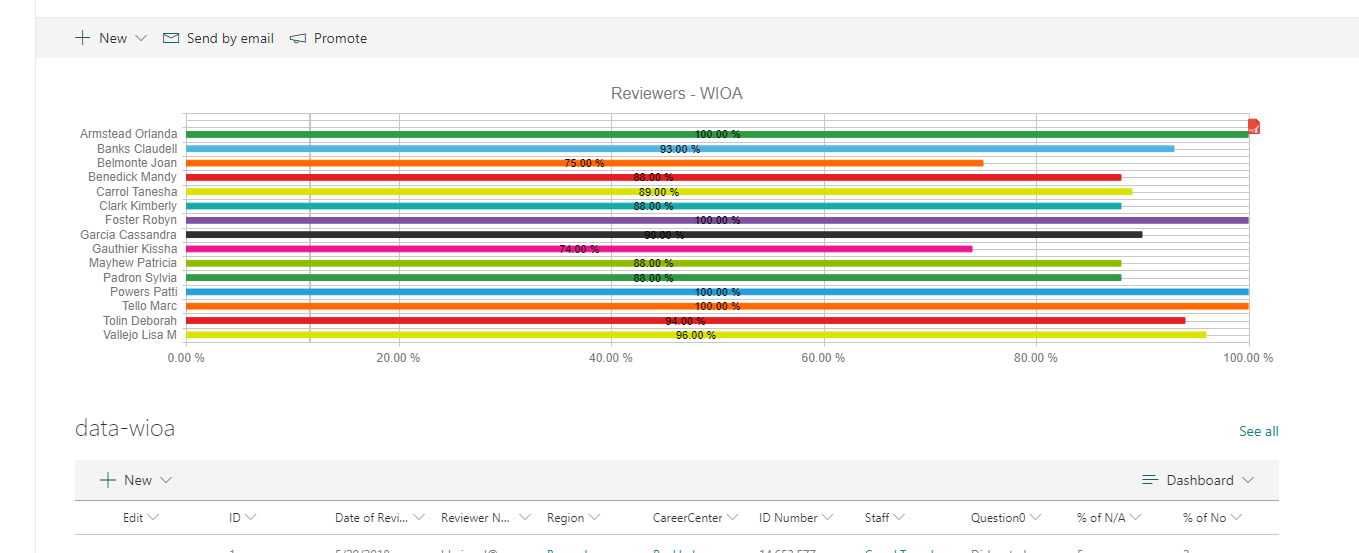
I did get to the point where the click events work when clicking the graph series but the filtering does not work. The guide does not inform you if this type of filtering works on O365/SharePoint online.
I spent about a day trying to get this to work and I just got frustrated. I will attempt again another day.
If I am doing something wrong or if there is different instructions I should follow for SharePoint Online let me know.


 .
.