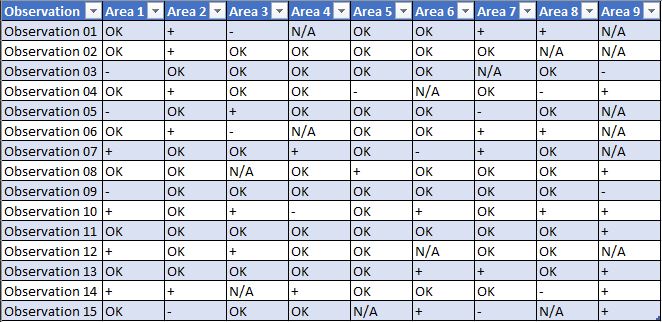
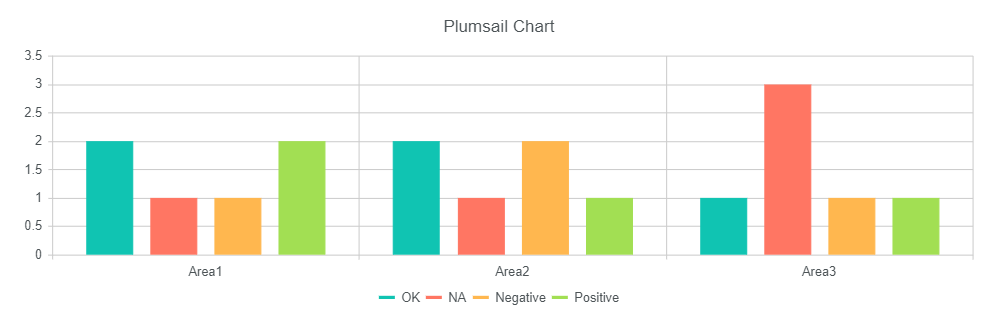
We have a list of ratings by different areas. + (positive) marks good practices, OK is fine and - (negative) is area for improvement, N/A does not apply for that area.
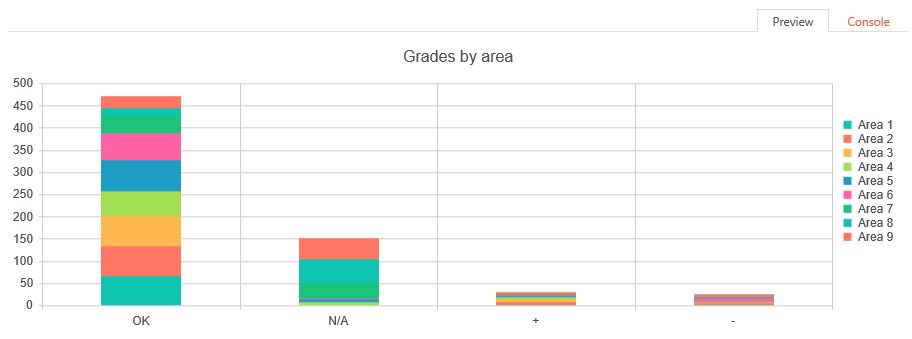
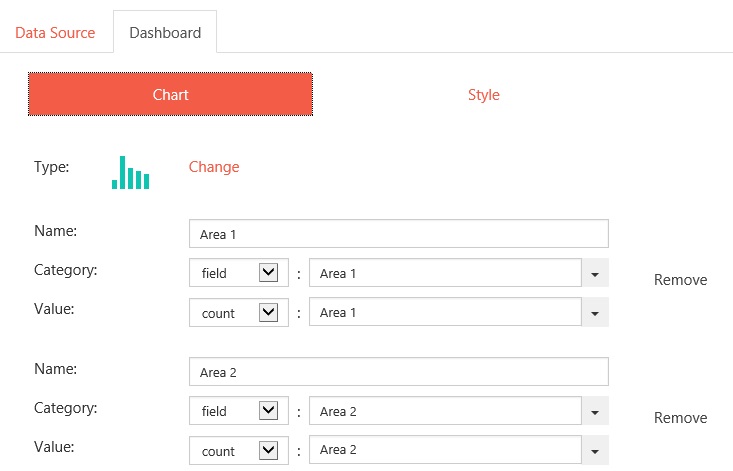
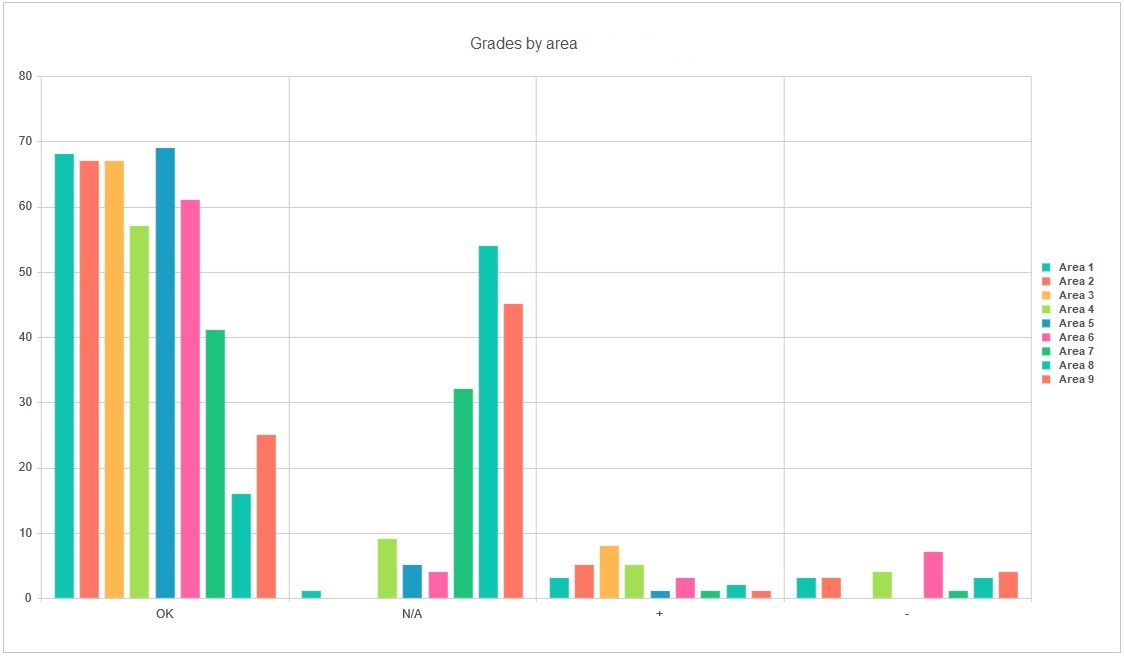
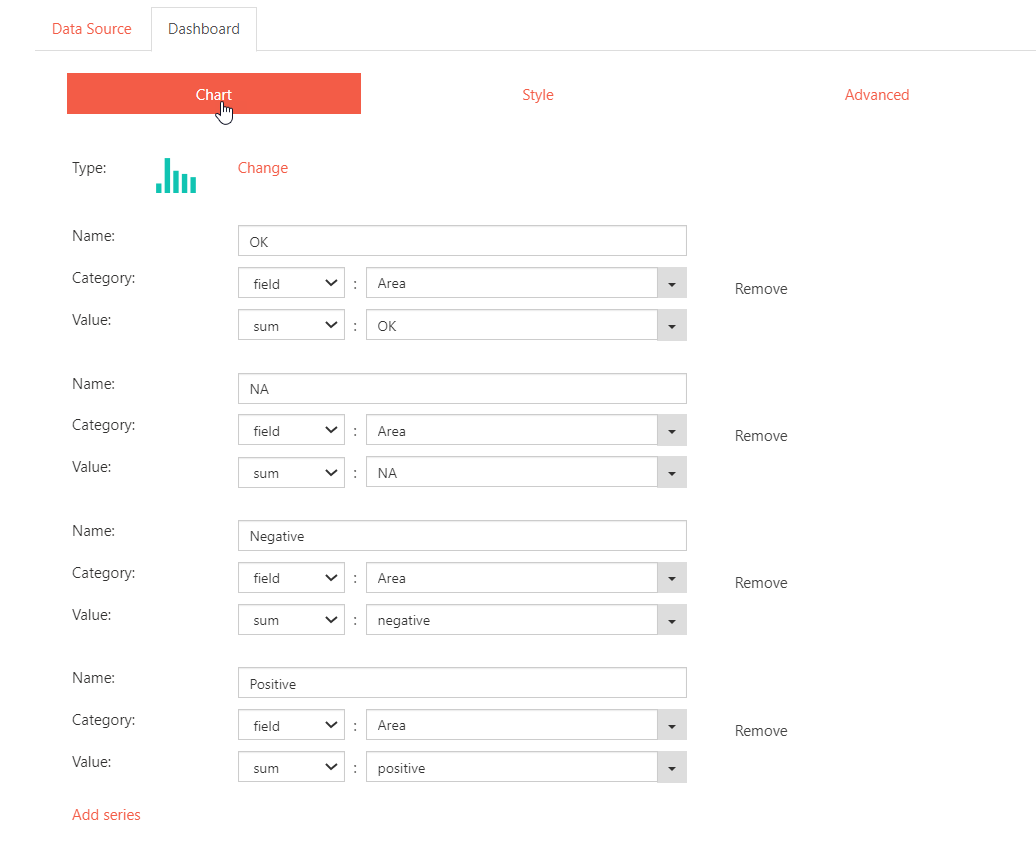
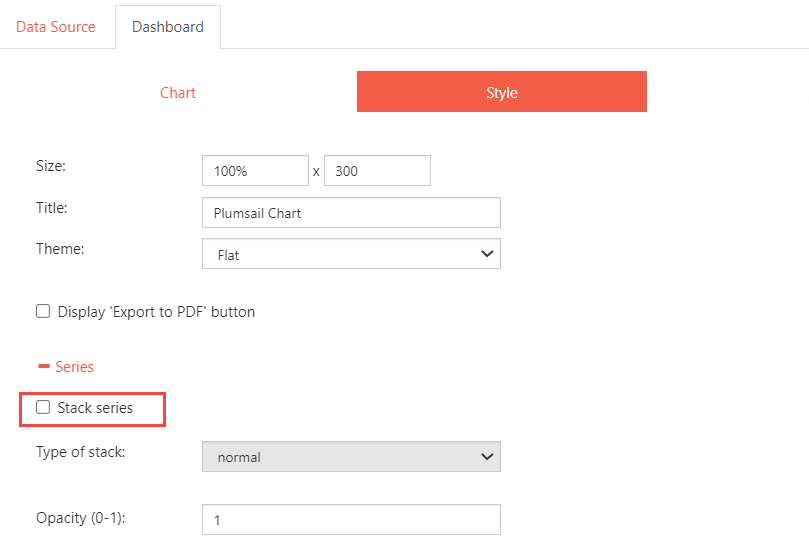
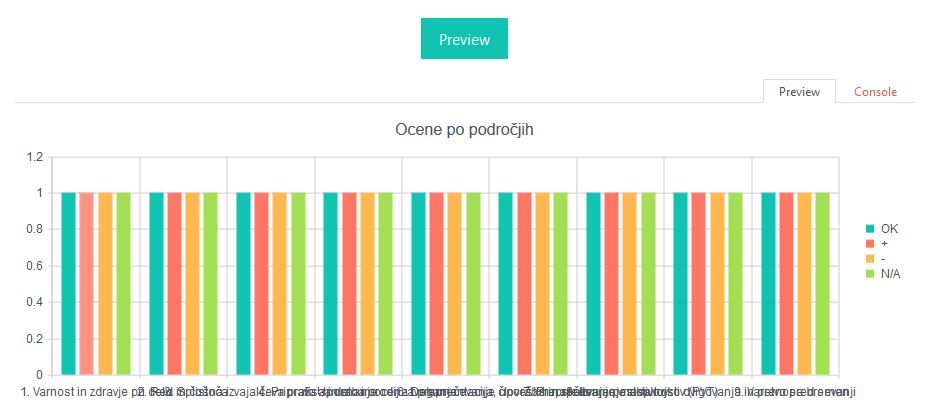
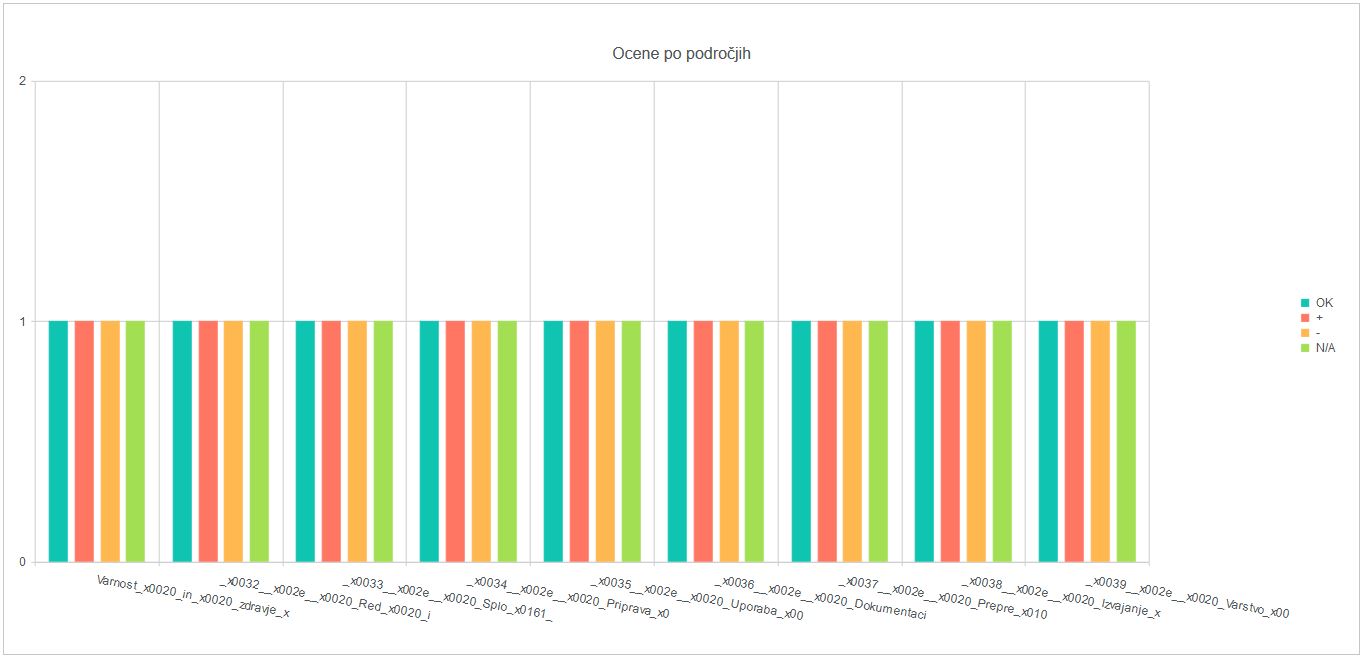
When I try to setup a bar chart I manage to get this result. I have no grouping in the Agregation section under Data source tab. I have 9 series entered in Chart section under Dashboard tab.
The table I presented in my first post was just an example of what kind of data I have in SharePoint list.
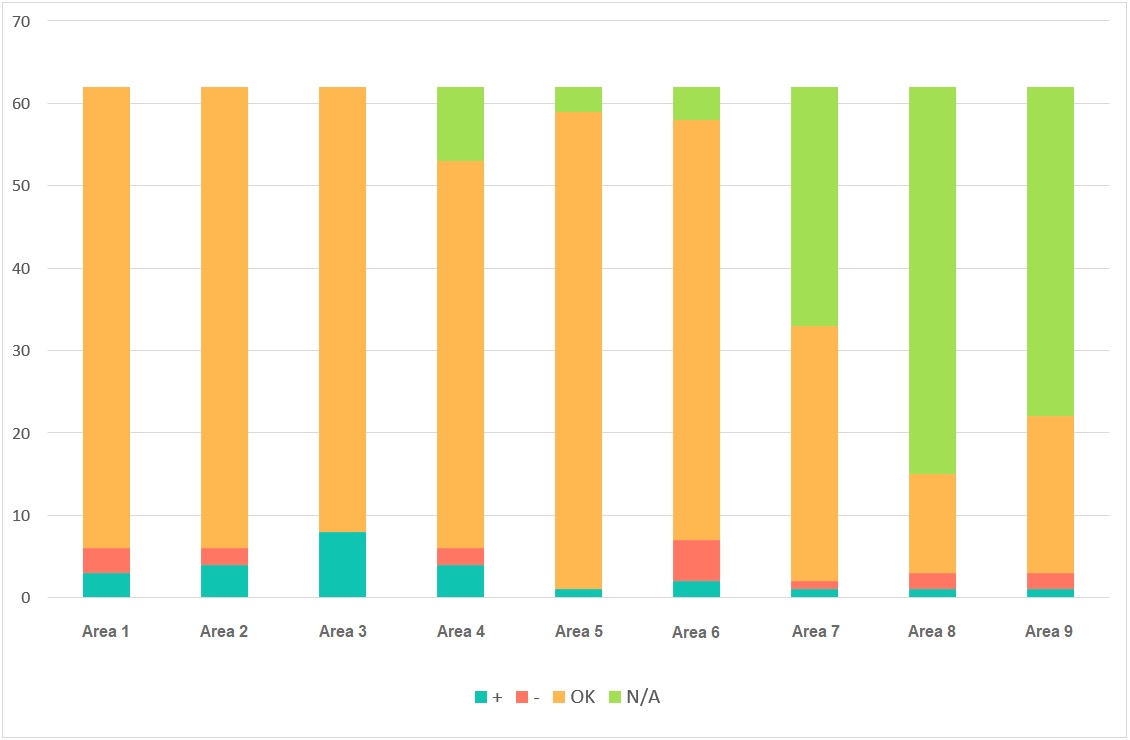
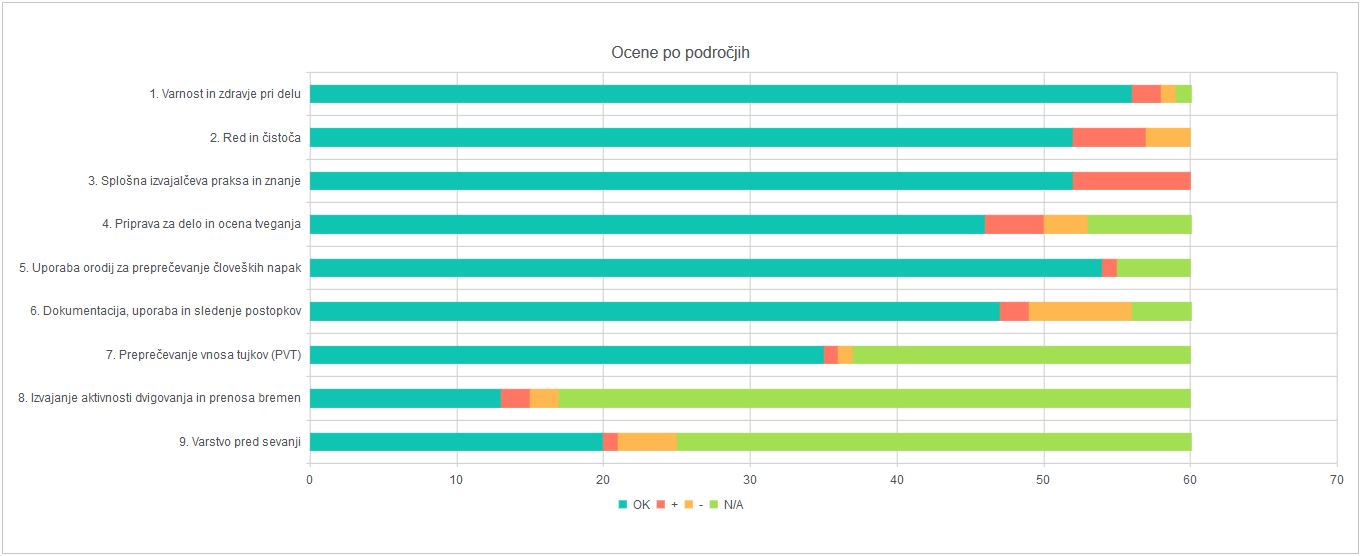
If I use that list to create a chart I get my first chart example. My second chart example is again just something I got requested of me, that was made in excel.
I guess I will have to make different kind of list to present the data. You probably also used different kind of list setup for your example.
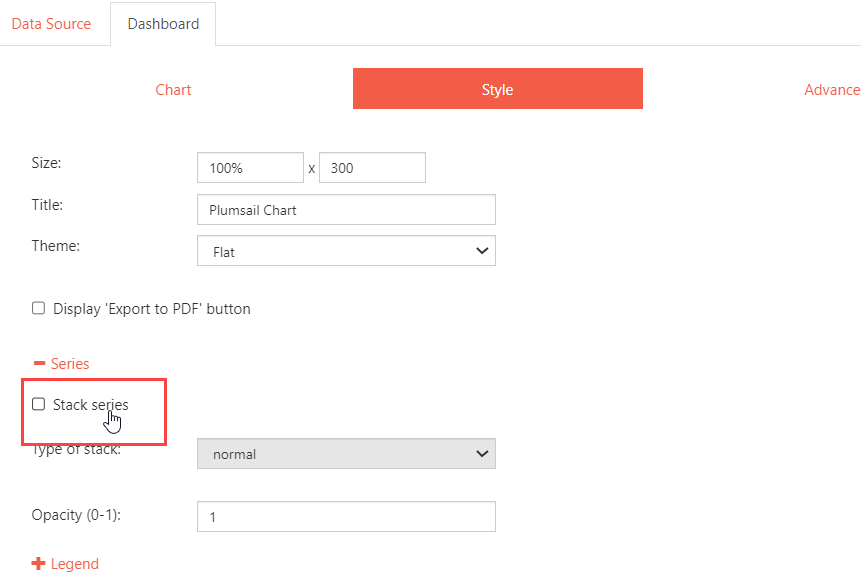
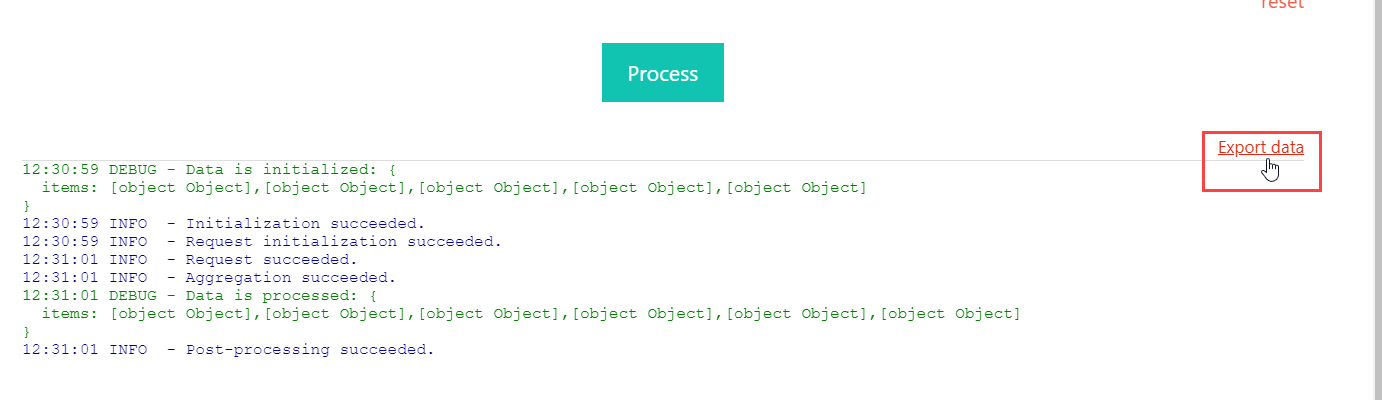
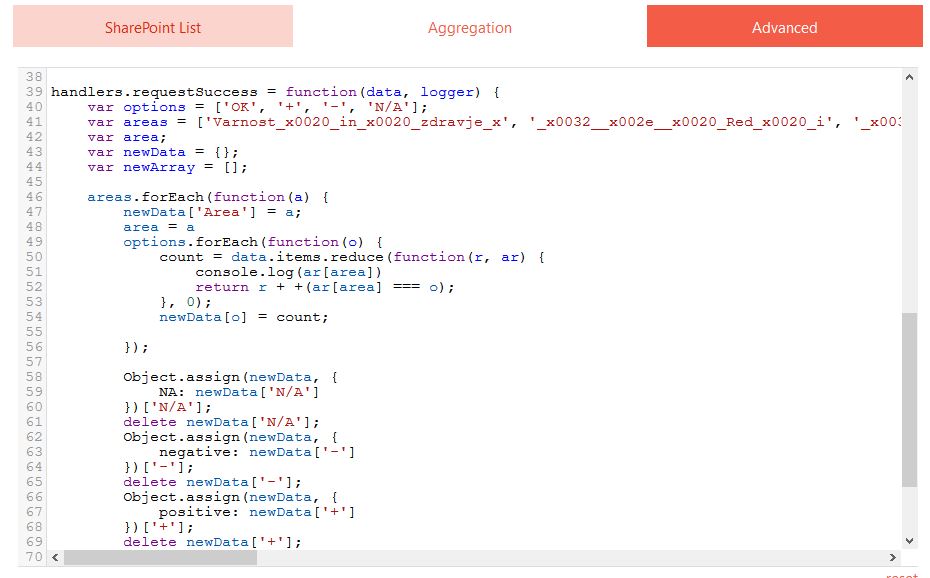
You can restructure the data with the code before using it to create a dashboard.
Add the code to the Data Source >> Advanced (please update it before using):
handlers.requestSuccess = function(data, logger) {
    var options = ['OK', '-', '+', 'N/A'];
    var areas = ['Area1', 'Area2', 'Area3'];
    var area;
    var newData = {};
    var newArray = [];

    areas.forEach(function(a) {
        newData['Area'] = a;
        area = a
        options.forEach(function(o) {
            count = data.items.reduce(function(r, ar) {
                console.log(ar[area])
                return r + +(ar[area] === o);
            }, 0);
            newData[o] = count;

        });

        Object.assign(newData, {
            NA: newData['N/A']
        })['N/A'];
        delete newData['N/A'];
        Object.assign(newData, {
            negative: newData['-']
        })['-'];
        delete newData['-'];
        Object.assign(newData, {
            positive: newData['+']
        })['+'];
        delete newData['+'];
        newArray.push(newData);
        newData = {}
        area = '';
    });
    data.items = newArray;
    return true;
}
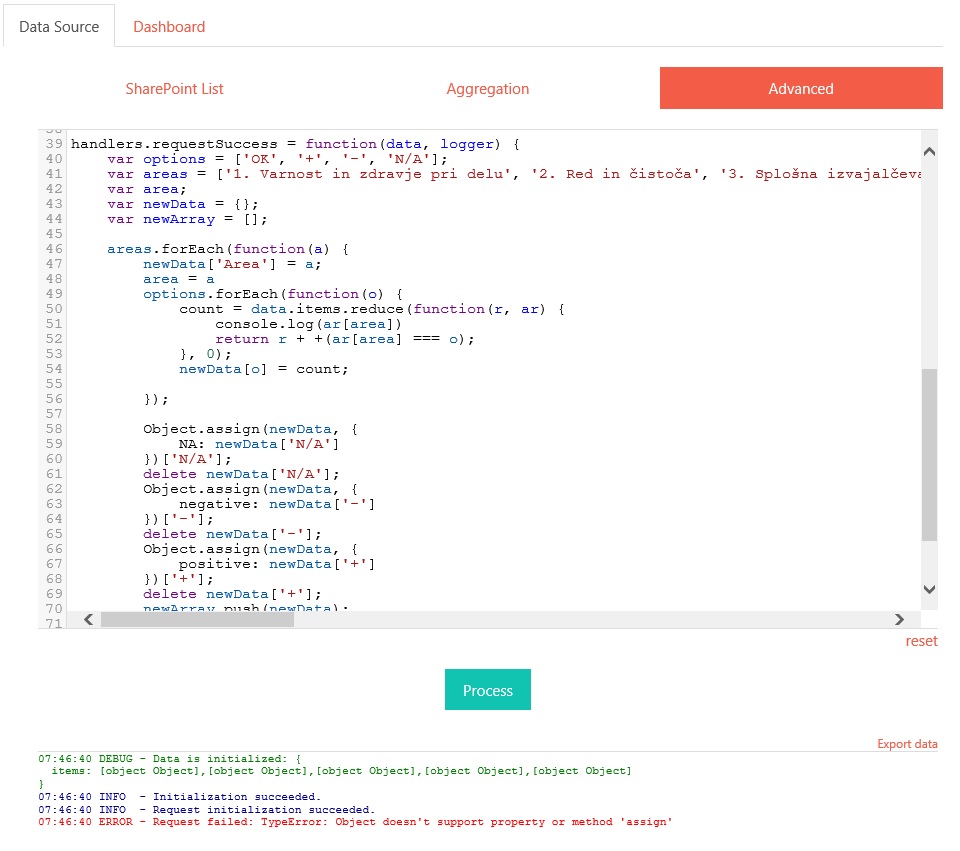
I updated the code with my actual columns.
When I select Process I receive:
ERROR - Request failed: TypeError: Object doesn't support property or method 'assign'
Sorry, Edge has Internet Explorer mode active. We use some other apps and are not fully supported yet with newer browsers.
So IE part is causing that error.