I am looking for information to make a recommendation to my employer about the Plumsail Dashboard for SharePoint Online.
Is it recommended to combine the Dashboard with the Actions or the Workflow Action Pack? In other words, is it necessary to have other Plumsail products to get the full use of the Dashboard?
Dear @smithme,
No, not necessarily, it can be used in isolation to great benefits. I can't think of many ways of how it can be integrated with other products - it just presents SharePoint data in charts.
Maybe, if you want to customize charts for our Helpdesk product, you need Dashboard Designer, but if you don't use our Helpdesk, Dashboard Designer will still be useful for any other type of charts.
How do you summarize data?
You have years of data but want to summarize by year?
You have data but just want the last seven days?
You want to group data by a category?
Dear @smithme ,
Yes, pretty much anything can be done with the tool. A fair warning though - for the max use, an extensive JavaScript customization will be required. Something basic can be done with no JavaScript, but something more advanced will likely need to have some adjustments.
The app retrieves data from a SharePoint list with a CAML query, which can then be aggregated, sorted, displayed in variety of ways, and even some interactivity can be added.
Get familiar with basic cases via our Getting Started examples:
They are easy step-by-step guides on how to build basic charts. Then you can look at other cases in our documentation, or dig the community to find some more specific details.
Feel free to ask questions, but building charts is often not an easy task - a lot of specific configurations and settings depend on how the data is stored, and each case is a little different. We're not as experienced in building charts as some of our clients - the tool provides almost endless opportunities, but it takes time to learn, good knowledge of JavaScript and some understanding of how charts work.
My recommendation is to get it. We've been using it for years now and it's been great. Very reasonable priced and a big plus is the great customer support.
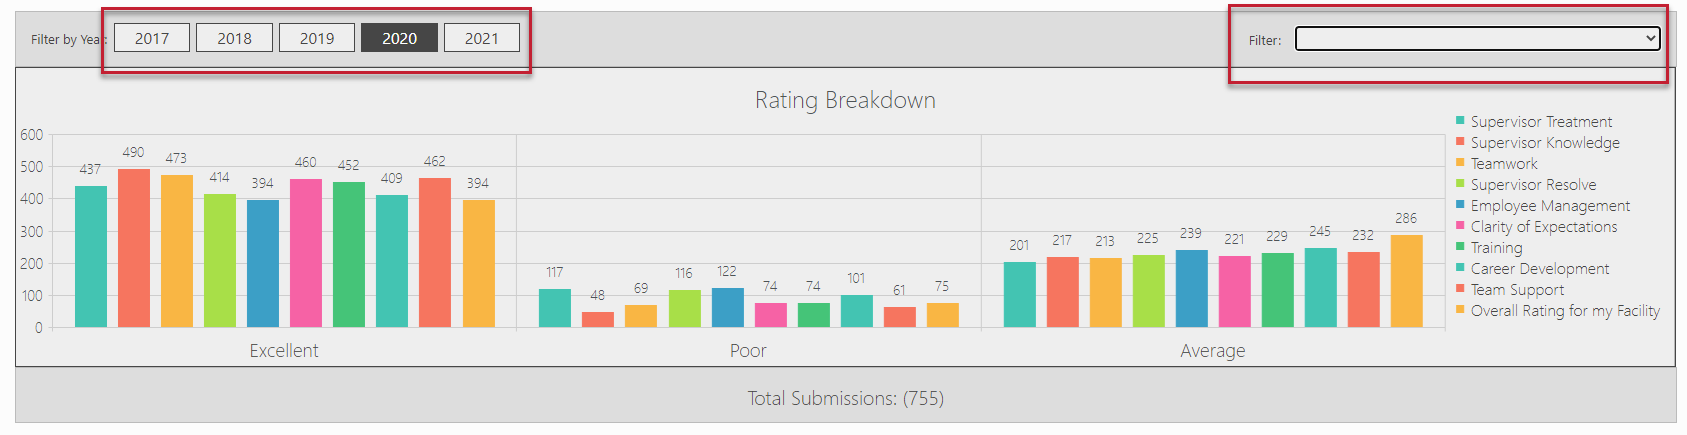
I was actually working on something just the other day.
Since it is all Kendo based, there is a lot you can do. With little bit of JS and CSS I was able to add filters that would dynamically filter list content.
Dear @jaitsujin,
That actually looks amazing - thank you very much for posting!
If you wouldn't mind sharing, could you send us your chart configuration and some more screenshots to support@plumsail.com? It's been a long time since we've updated the documentation, and I think an example like this might actually be very helpful to other users. Of course, this is up to you, and you don't have to, but we'd be happy to share something as cool