Dear TKey,
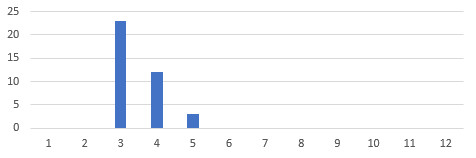
The issue is that the chart only has access to the data that is already in the List, it cannot add data that could be in the list, such as all other months. But, of course, it's possible to solve this issue, by adding virtual items to data which would contain all the other months, so that the designer knows that they are possible.
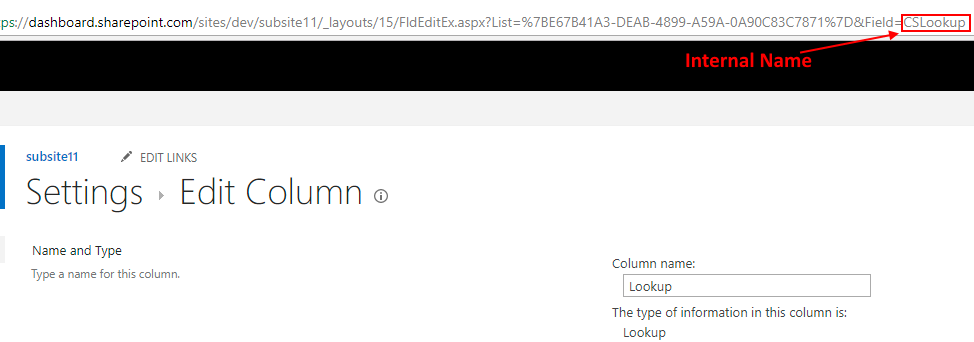
Please, make sure that the InternalName of the month field is in fact month, you can do it by going to the List where it's located, going to List Settings, clicking on the month column and checking the URL:
Now, that you know the InternalName, open Chart's configuration and in Data Source -> Advanced, replace handlers.finish with the following code:
handlers.finish = function(data, logger) {
  data.items.map(function(item) {
    //Amount is the New Field we will use to check if the item needs to be counted or not
    item.Amount = 1;
    //here you need to use the InternalName of the month field
    item.month = parseInt(item.month);
  });

  for(var i = 1; i <= 12; i++){
    var item = {};
    //Set Amount to zero, so the virtually added items do not appear on the chart
    item.Amount = 0;
    //here you need to use the InternalName of the month field
    item.month = i;
    data.items.push(item);
  }

  //This will now sort all the months in correct order, after we added new ones
  data.items.sort(function(a, b) {
    //here you need to use the InternalName of the month field
    return a.month - b.month;
  });

  logger.debug('Data is processed: ', data);
  return true;
}
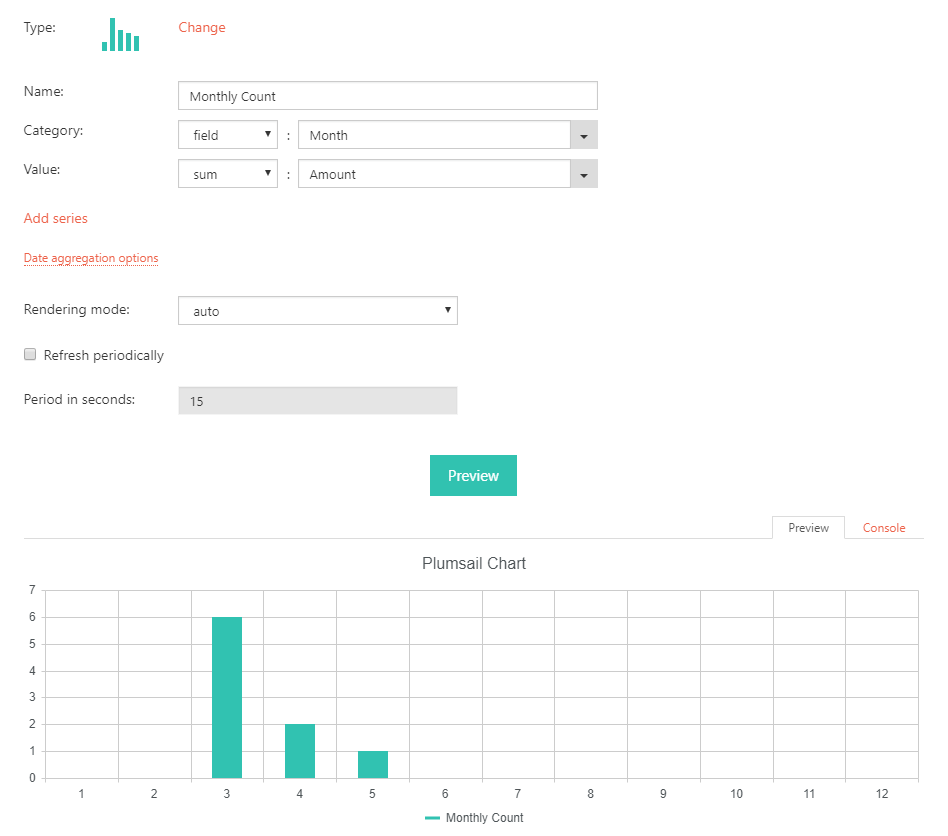
This code will first make sure that all actual values have Amount set to 1, so you can correctly count them on the Chart. Next, it will add 12 extra items, one with each month value, but Amount set to 0. Then it will also sort months in order, so they look nicer on the chart.
Dear @TKey,
I assume that other conditions are the same, correct? In this case, you can run the following code instead:
handlers.finish = function(data, logger) {
  data.items.map(function(item) {
    //Amount is the New Field we will use to check if the item needs to be counted or not
    item.Amount = 1;
    //here you need to use the InternalName of the month field
    item.month = parseInt(item.month);
  });

  for(var i = 1; i <= 12; i++){
    var item = {};
    //Set Amount to zero, so the virtually added items do not appear on the chart
    item.Amount = 0;
    //here you need to use the InternalName of the month field
    item.month = i;
    data.items.push(item);
  }

  var today = new Date();
  var currentMonth = today.getMonth() + 1;

  //This will now sort all the months in correct order, after we added new ones
  data.items.sort(function(a, b) {
    if (a.month == currentMonth) {
      return 1;
    }
    if (b.month == currentMonth) {
      return -1;
    }
    if (a.month > currentMonth && b.month > currentMonth) {
      return a.Month - b.Month;
    }
    if (a.month > currentMonth && b.month < currentMonth) {
      return -1;
    }
    if (a.month < currentMonth && b.month > currentMonth) {
      return 1;
    }
    if (a.month < currentMonth && b.month < currentMonth) {
      return a.Month - b.Month;
    }
  });

  logger.debug('Data is processed: ', data);
  return true;
}
Dear Nikita,
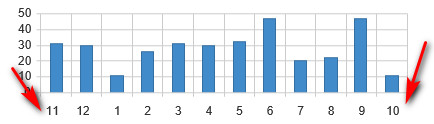
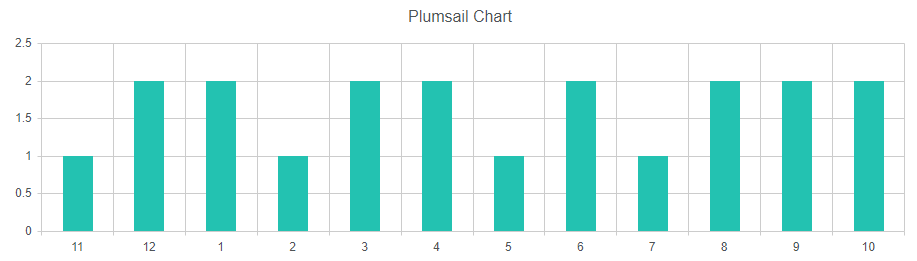
Here is what I would like to accomplish… in the month of October the last item displayed on the chart would be the current month (10), the first would be the November (11) from the past year, in November the last one would be current November (11) and the first item would be December from the past year (12)…
I think the way my chart month column is setup, this is not possible. The month is a calculated column from “Created” column =TEXT([Created],“mm”) … number 1 to 12, we would need to have both a month and a year added, and chart generated based on both values…
Dear @TKey,
Yes, I understand - this is exactly what the code does. You do not actually need a year (unless the List itself contains Items that shouldn't be in the chart - in this case you need at least some option to get the year).
The code takes current month and makes it a top choice - moves to the right. Then, if the month is after current month (e.g. after October) - it moves them back, while moving the ones before current further. Then, it sorts them in the correct order.
Once again, this should work - the only issue might be that you will see values from both current year and previous years under the same month, because all items are taken from the list. If this is the case, then we do need an option to check the year as well.
Dear Nikita,
Yes, you are completely right… I did something wrong and months did not shift…I re-applied the code and it is working fine now, however I need to separate / filter out items from other years. Can you help me?
Hmm… I think creating a view to filter out and display items for the last 12 months would be the easiest way here, right?
Dear @TKey,
There are several options here, actually. But the easiest would probably be to create a new calculated column year and give it the following formula:
=IF([Created]="","",""&YEAR([Created]))
Then, add the column to chart in Data Source -> SharePoint List. Finally, customize the code to give Amount = 0 to all items that we aren't interested in:
handlers.finish = function(data, logger) {
  var today = new Date();
  var currentMonth = today.getMonth() + 1;
  var currentYear = today.getFullYear()

  data.items.map(function(item) {
    //here you need to use the InternalName of the month field
    item.month = parseInt(item.month);
    //here you need to use the InternalName of the year field
    item.year = parseInt(item.year);

    //condition to check if item is from current year or last year AND month > currentMonth
    if(item.year == currentYear || item.month > currentMonth && item.year == currentYear - 1){
      //Amount is the New Field we will use to check if the item needs to be counted or not
      item.Amount = 1;
    }
    else{
      item.Amount = 0;
    }
  });

  for(var i = 1; i <= 12; i++){
    var item = {};
    //Set Amount to zero, so the virtually added items do not appear on the chart
    item.Amount = 0;
    //here you need to use the InternalName of the month field
    item.month = i;
    data.items.push(item);
  }

  //This will now sort all the months in correct order, after we added new ones
  data.items.sort(function(a, b) {
    if (a.month == currentMonth) {
      return 1;
    }
    if (b.month == currentMonth) {
      return -1;
    }
    if (a.month > currentMonth && b.month > currentMonth) {
      return a.month - b.month;
    }
    if (a.month > currentMonth && b.month < currentMonth) {
      return -1;
    }
    if (a.month < currentMonth && b.month > currentMonth) {
      return 1;
    }
    if (a.month < currentMonth && b.month < currentMonth) {
      return a.month - b.month;
    }
  });

  logger.debug('Data is processed: ', data);
  return true;
}