Hi, I've got a list that contains data on when someone was admitted to hospital and the ward they were admitted to. I'm using columns called MonthAdmitted (which has the month they were admitted e.g. 6) and Ward.
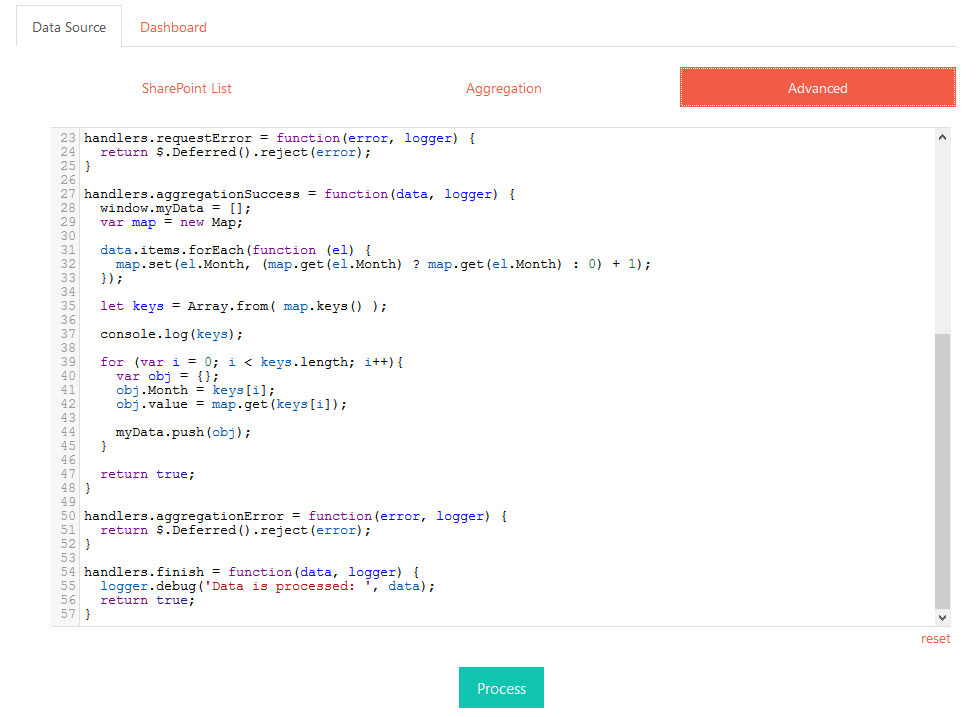
In the aggregation section I've grouped by Ward and set up tmpMonthTotal which is a count of MonthAdmitted.
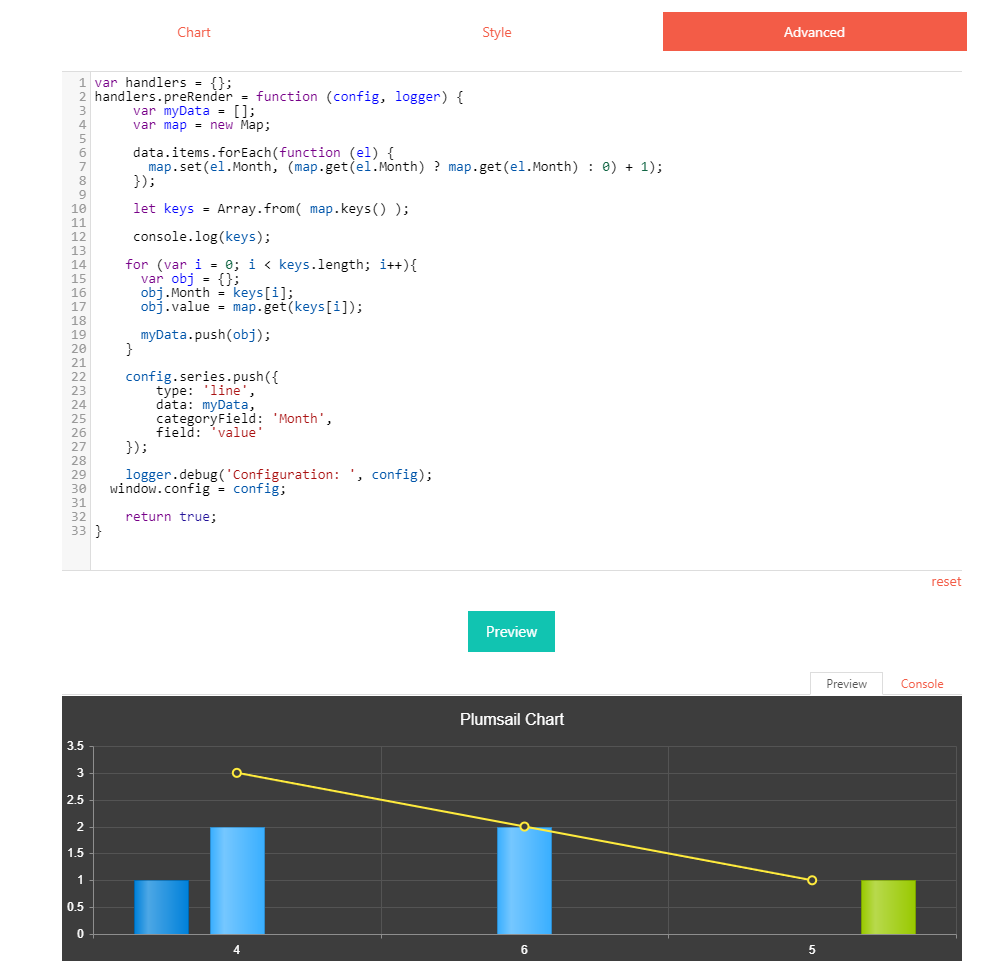
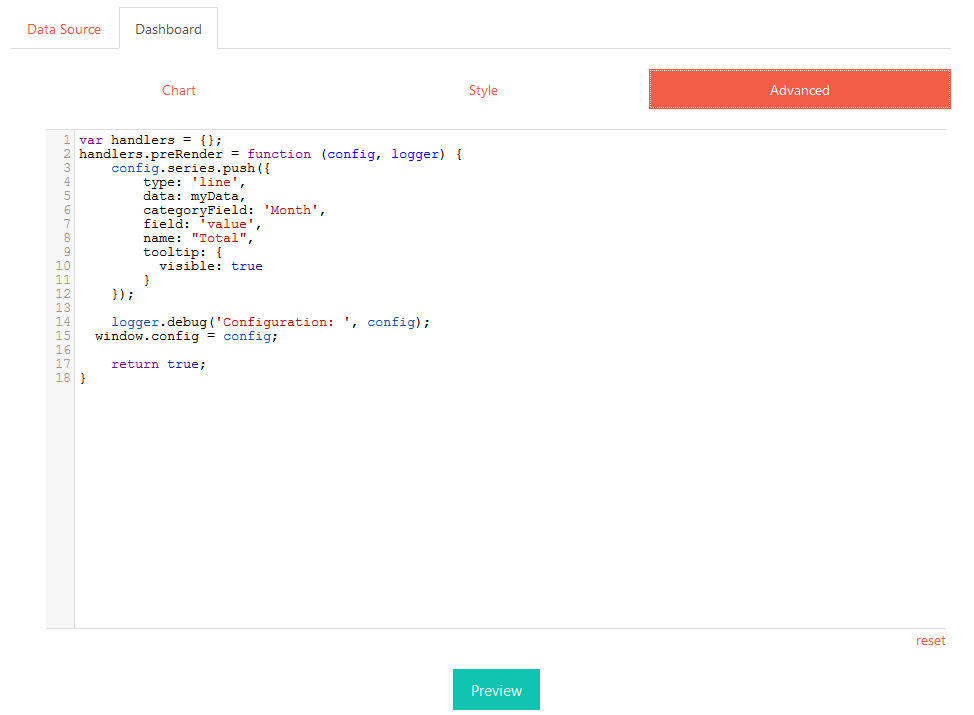
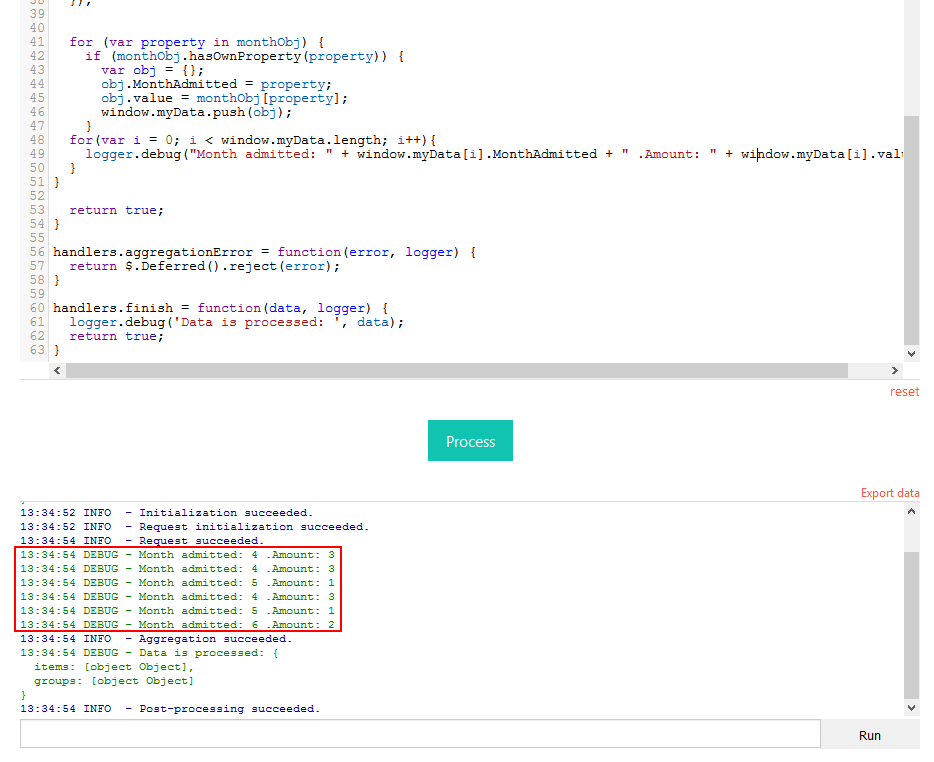
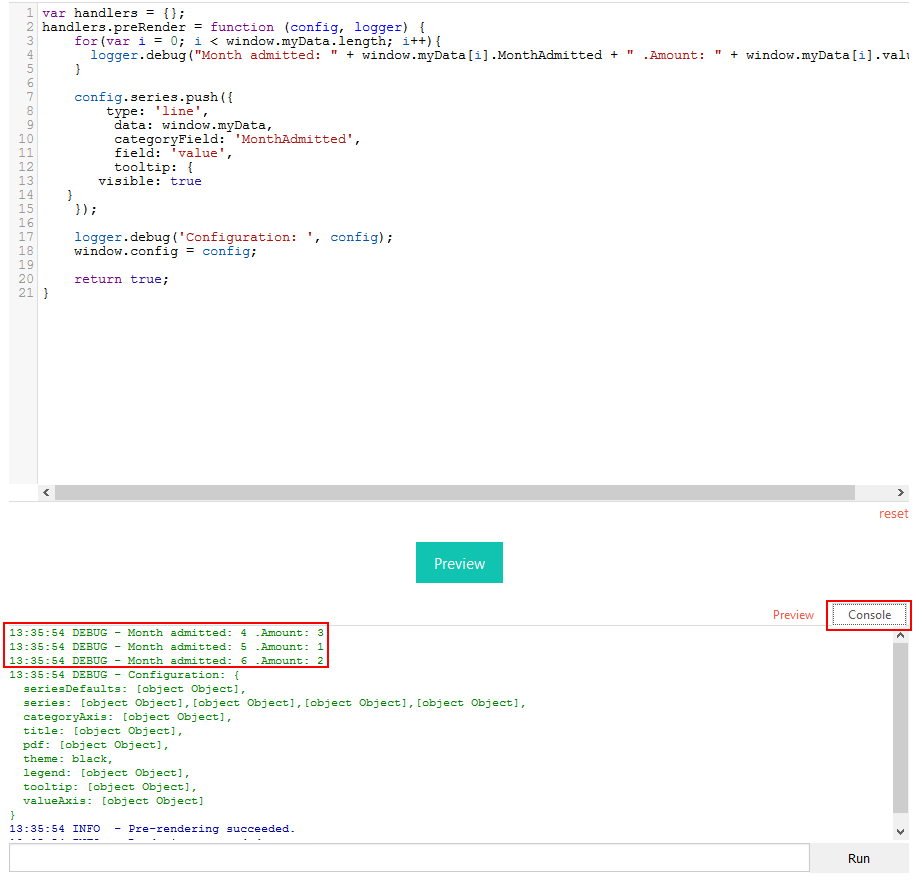
I've then added some code to the Dashboard Advanced section:
var handlers = {};
handlers.preRender = function (config, logger) {
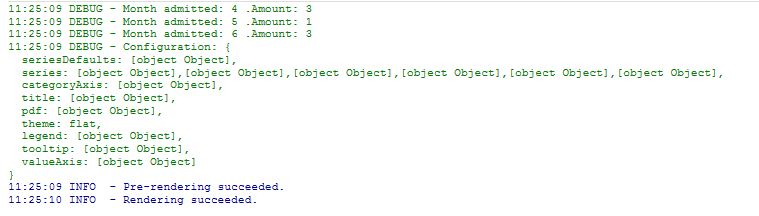
logger.debug('Configuration: ', config);
var data = config.series[0].data;

config.series.push({
    name: 'Total',
    type: 'line',
    data: data,
    field: 'tmpMonthTotal',
    categoryField: 'MonthAdmitted',
    tooltip: {
    visible: true
  }
});

window.config = config;
return true;
}
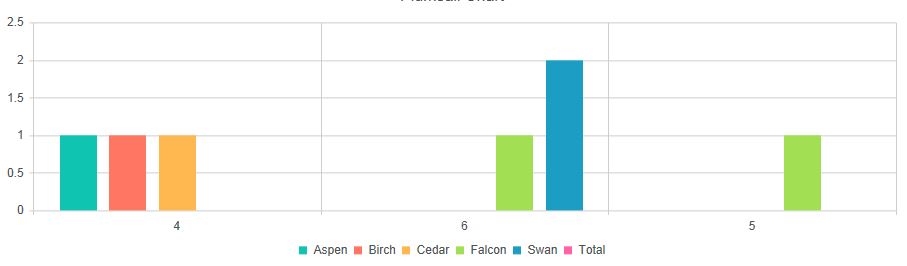
The bar chart looks fine, but I can't get the line that I've added, which I want to display the total admissions for the month, to show up properly on the chart. Please tell me what I'm doing wrong.
"Display each group as a separate series" is ticked, which I think may be an issue, but without it my bar chart doesn't display properly.
Thank you.