Hi Guys
How can i add two columns of data to the same chart?
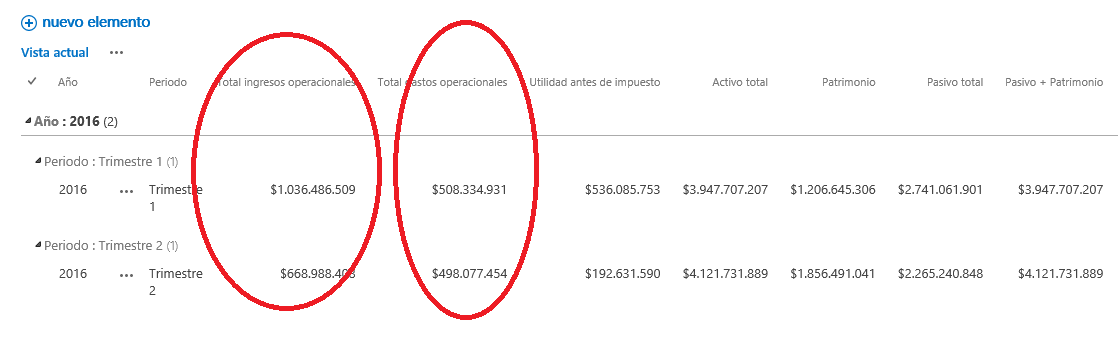
I have a list in which i have two value columns that i need to chart: Total ingresos operacionales and Total Gastos operacionales
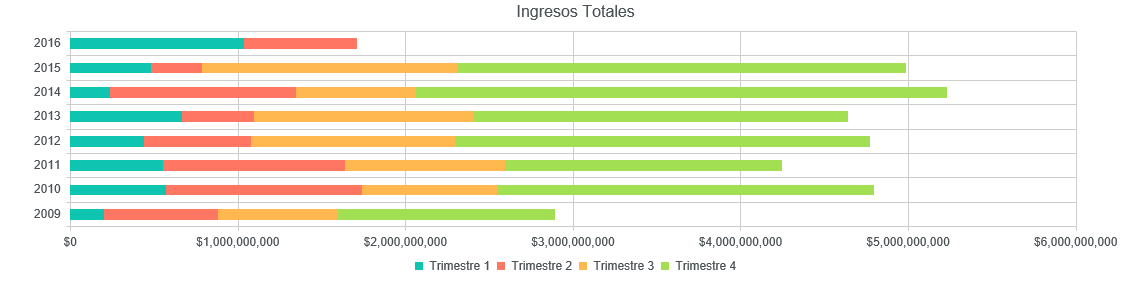
What I have right now is a chart only displaying 1 Value Column but I need to chart both to be shown in the same category.
Thanks for your help!
Hi Dimitry
How do i activate the series part? because when i go to my app it doesn´t show the series option that is displayed in the video.
Are you using SharePoint online or on-premises?
Then you just need to upgrade the app: remove it from the site contents, wait 2-3 minutes, and add it again from the store. All existing charts will continue working properly.
Perfect works great thanks!