Good Morning,
I am having an issue with one of my line charts. I would like to take the oldest 5 items in a list and display them by date in the line chart. The list contains our "out of contract" sales. I would like to grab the oldest 5 sales that have been approved by the customer and display them by date and $ amount. I have created a list view that will display the data exactly as intended, I'm just having difficulty accuratly reflecting that data in the chart. Please see attached screenshot.
Hello, Josh!
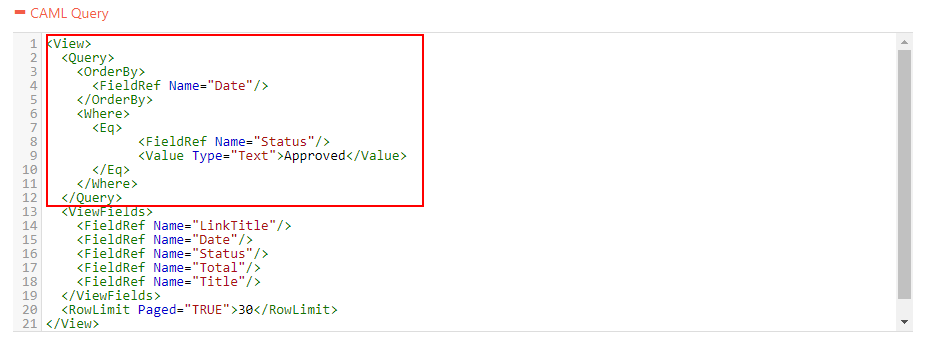
Sorry for the delay. First, you need to configure CAML Query to only select orders that have "Approved" status and also make items ordered by Date you are displaying in the chart.
It should look like this, but with your field names and values:
<Query>
    <OrderBy>
      <FieldRef Name="Date"/>
    </OrderBy>
    <Where>
      <Eq>
            <FieldRef Name="Status"/>
            <Value Type="Text">Approved</Value>
      </Eq>
    </Where>
</Query>
Then go to Data Source -> Advanced tab, and replace handlers.requestSuccess with this code:
handlers.requestSuccess = function(data, logger) {
  for (var i = data.items.length; i > 5; i--)
  {
  	 data.items.shift();
  }
  return true;
}
It will remove all the items, except for the last five. Since we only have approved items and they are filtered by the date, it should remove only the older items and leave only the last five to display them in the chart.
Let me know if this works for you or if you have some difficulties configuring the chart.
Nikita,
Thank you for the reply. The chart is looking much better now, however the data being reflected is still somewhat inaccurate. I'm not sure what would cause this but some of the dates from my 5 items are correct in the chart, and some are off by a day or two. As you can tell by the second attached screenshot, the chart has plots on 4/7 4/13 4/25 5/4 and 5/16. However the dates from the list (seen in the first screenshot) are 4/7 4/14 4/27 5/5 and 5/18.
Do you have some other items in the list, that have these dates? (4/7 4/13 4/25 5/4 and 5/16)
If you do, that might mean that the problem is with removed dates, incorrect values are being removed. Otherwise, the problem is with presentation and we’ll try to figure out what causes the dates to appear differently on the chart.
Nikita,
Thank you again for your response. No I do not have other items in the list that contain those dates.
The problem might be caused by interpolation of dates or differences in time zones. We'll need to see how the dates are interpreted by the Designer.
Replace Data Source -> Advanced code with this after replacing Date with the name of your field:
handlers.requestSuccess = function(data, logger) {
  for (var i = data.items.length; i > 5; i--)
  {
  	 data.items.shift();
  }
  for (var i = 0; i < data.items.length; i++)
  {
  	 logger.debug(data.items[i].Date);
  }
  return true;
}
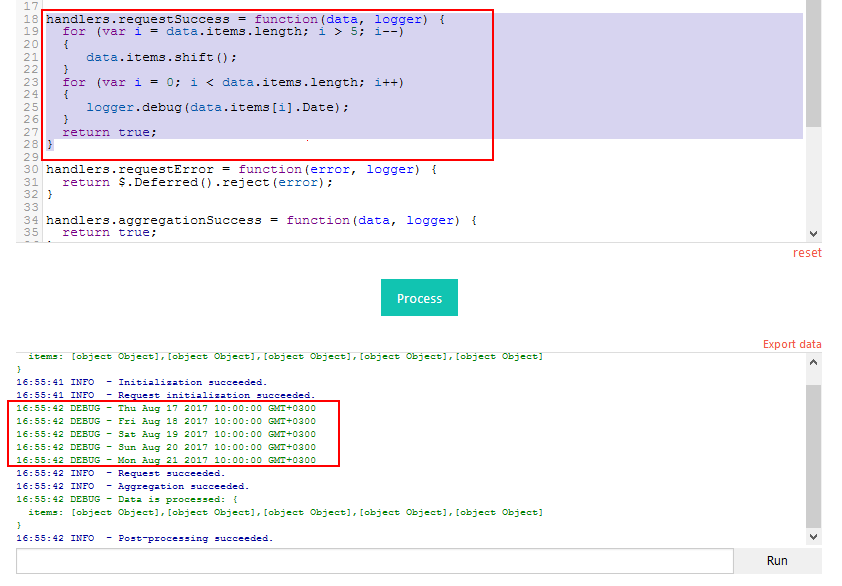
And show us a screenshot of the debugger:
Yes, that would make sense. The screenshot is attached. Thanks again for your assistance!
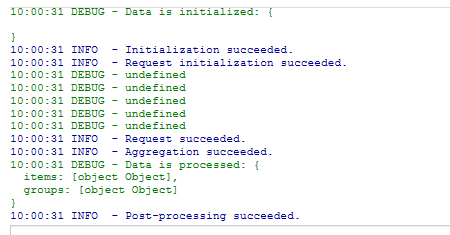
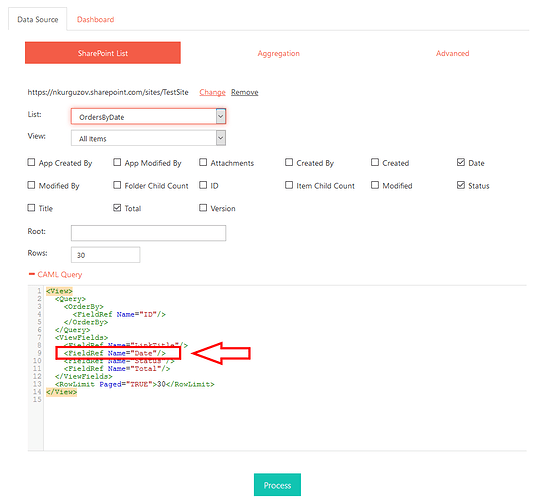
Make sure that you use the actual name of the field in the code, so we get to see actual dates instead of Undefined.
logger.debug(data.items[i].YourDateFieldName);
You can check field name in Data Source -> SharePoint List -> CAML Query:
Derp! Sorry, I read and replied that first thing this morning and clearly had not had enough coffee. Attached is the screenshot with the correct output.
The dates in the console output are correct. They just aren’t being rendered correctly on the chart.
Thanks!
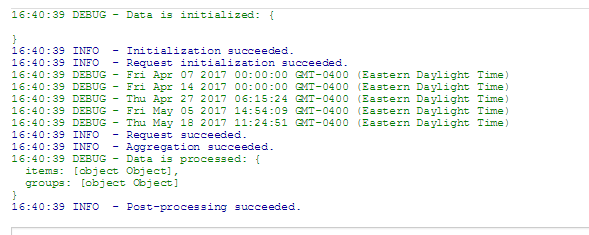
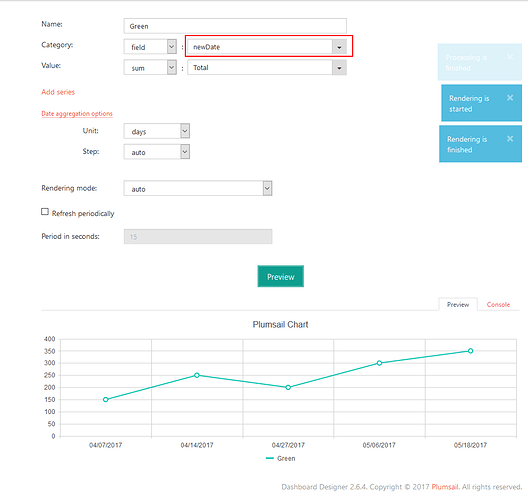
Okay, so the issue here is the Step between dates. Because of how charts are build when processing dates, it gives certain interval between dates and this interval is the same between all available dates, even if the interval is not the same.
So it will approximate this interval and the dates are not displayed correctly. If you look at your graph, the Step is automatically set to 3 days. Now, I understand that this is not the result you want and there are two ways this issue can be solved.
One way is to set Step to 1 day. This will work in every situation and doesn't require coding, but it looks very messy to be honest. You don't need every single day displayed on your chart, I am sure of it.
Instead, we can use code to create new text field for each item, based on the date which will display correctly. Simply go to Data Source -> Advanced and replace handlers.requestSuccess with this code:
handlers.requestSuccess = function(data, logger) {
  for (var i = data.items.length; i > 5; i--)
  {
  	 data.items.shift();
  }

  Date.prototype.mmddyyyy = function() {
  	var mm = this.getMonth() + 1;
  	var dd = this.getDate();

    return [(mm>9 ? '' : '0') + mm  + "/",
            (dd>9 ? '' : '0') + dd  + "/",
            this.getFullYear() ].join('');
  };

  for (var i = 0; i < data.items.length; i++)
  {
    var date = data.items[i].Date; // replace Date with the name of your field
    data.items[i].newDate = date.mmddyyyy();
  }

  return true;
}
Then go to Dashboard and select NewDate as Category: field. It should work, just tested it:
