Hi,
We're currently using Dashboard Designer. One of the things we have made is a graph counting number of certain occurences for the last 30 days.
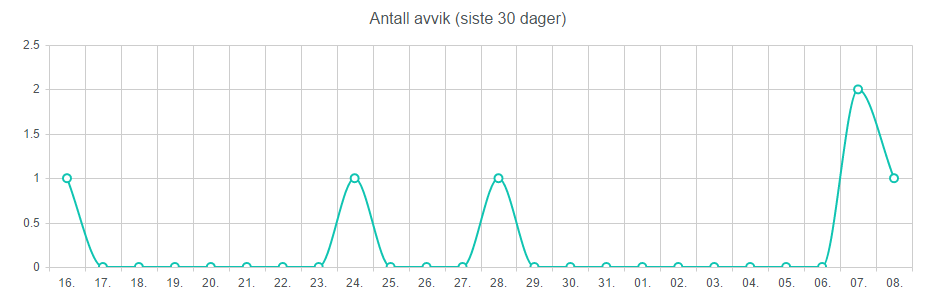
While the graph is correct, a wish however, is for it to show the start and end date even if there wouldn't happen to be any data for those days.
For example, in the attached image, that it would instead show the graph from 09. (included) to 08. (included), with values of 0 (since date of posting is the 8th).
I tried to look into the preRender function, but not been able to find anything that could manipulate the start and end (without also messing up the returned list data).
The current settings we use are:
In the Dashboard tab
- Chart
** Category: Time
** Value: Time
** Aggregate over category - Unit: days
** Rendering mode: auto
Any ideas/suggestions on how this could be solved?