Hi,
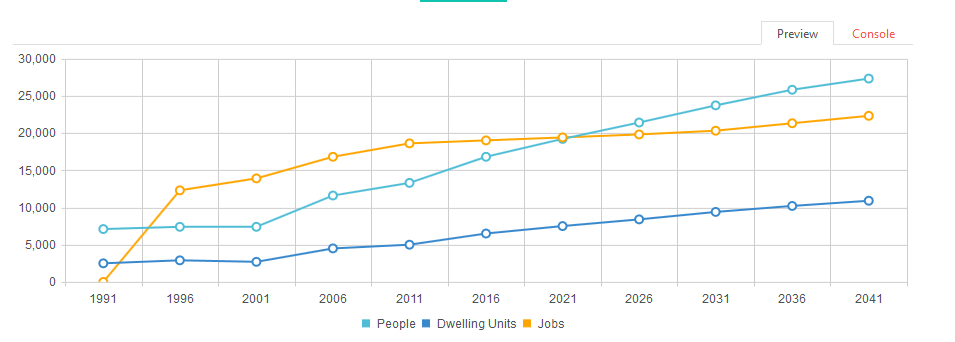
My current line chart has some 0 as value. Instead of drawing a dot at 0, is it possible to to remove that point all together? See chart for 1991, I'd like the orange line start at 1996.
My data item looks like:
[code]14:35:19 DEBUG - {
_events: [object Object],
Date: Tue Dec 31 1991 00:00:00 GMT-0800 (Pacific Daylight Time),
DwellingUnits: 2500,
Employment: 0,
Municipality: Electoral Area A,
MunicipalityId: 21,
_Municipality: [object Object],
Population: 7500,
PopulationType: Actual,
Year: 1991,
[/code]
Thanks.