if I create a pie chart such as this:

I can show the label and how the data representing the volume.
But I can't show also the percentage.
Example:"[quote]634 rows / 63%[/quote]"
if I create a pie chart such as this:
I can show the label and how the data representing the volume.
But I can't show also the percentage.
Example:"[quote]634 rows / 63%[/quote]"
can I do with a piece of code in the chart handler?
We can’t see your screenshot.
Better ? (issue with Dropbox, apologies)
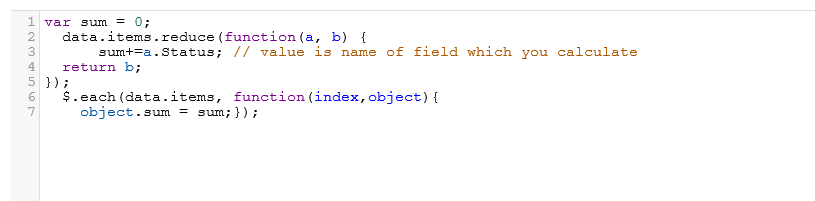
You can just put in tab DataSource -> Advanced this code into handler.finish:
var sum = 0;
  data.items.reduce(function(a, b) {
      sum+=a.value; // value is name of field which you calculate
  return b;
});
  $.each(data.items, function(index,object){
    object.sum = sum;});
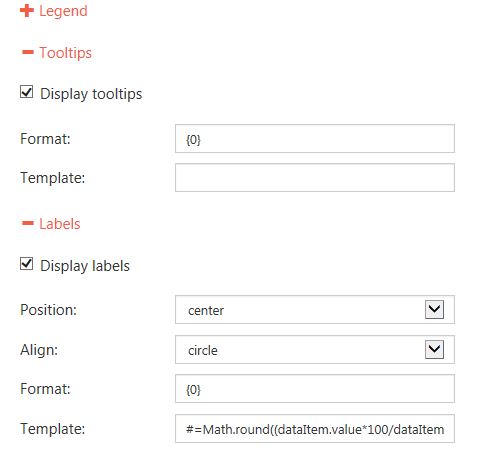
and in Dashboard -> Style -> Labels -> template put this:
#=Math.round((dataItem.value*100/dataItem.sum),1)# %where “value” is name of field, which value you want to show.
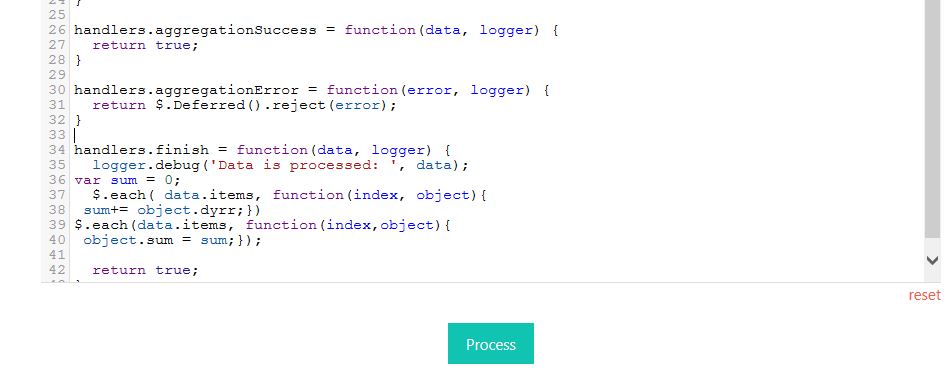
added as requested:
[code]handlers.finish = function(data, logger) {
logger.debug('Data is processed: ', data);
var sum = 0;
data.items.reduce(function(a, b) {
sum+=a.dyrr; // value is name of field which you calculate
return b;
});
$.each(data.items, function(index,object){
object.sum = sum;});
return true;
}[/code]
the process failed:
[quote]11:35:06 DEBUG - Data is initialized: {
items: [object Object],[object Object],[object Object],[object Object],[object Object]
}
11:35:06 INFO - Initialization succeeded.
11:35:06 INFO - Request initialization succeeded.
11:35:06 INFO - Request succeeded.
11:35:06 INFO - Aggregation succeeded.
11:35:06 DEBUG - Data is processed: {
items: [object Object],
groups: [object Object]
}
[color=#FF0000]11:35:06 ERROR - Post-processing failed: TypeError: data.items.reduce is not a function[/color][/quote]
Try this one, please
var sum = 0;
$.each( data.items, function(index, object){
sum+= object.dyrr;})
$.each(data.items, function(index,object){
object.sum = sum;});
And tell, please, what browser do you use.
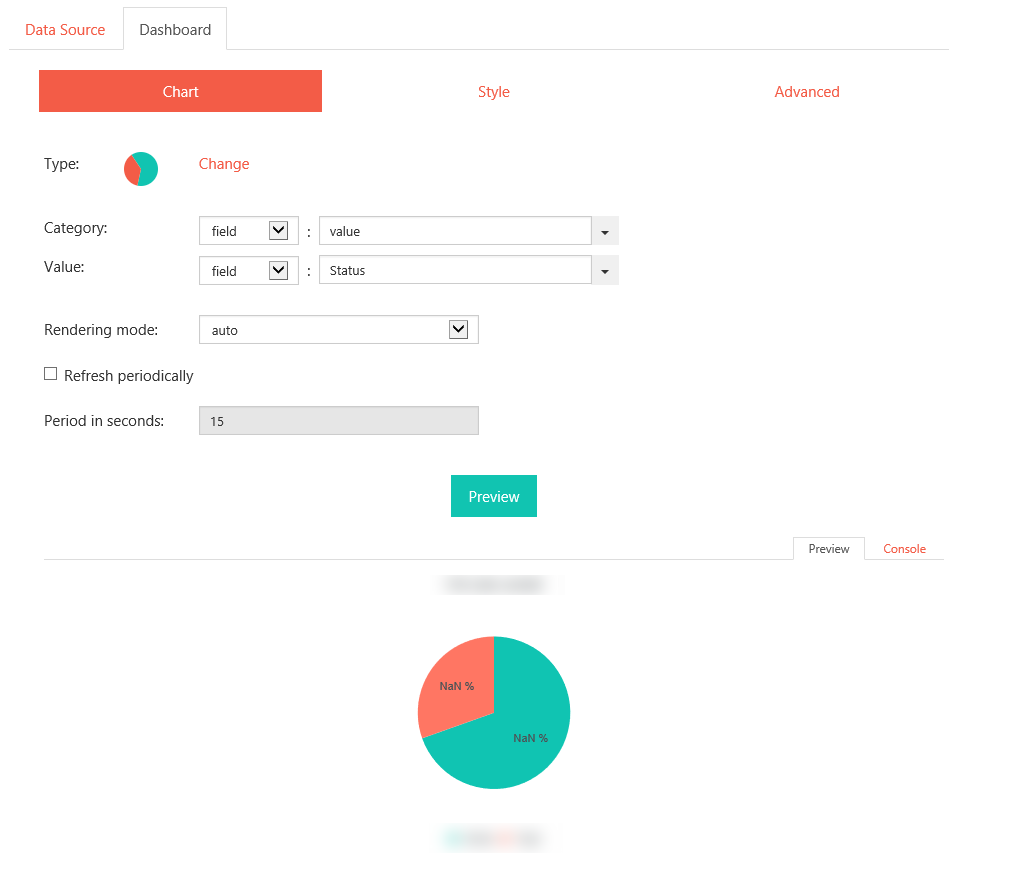
Hi,
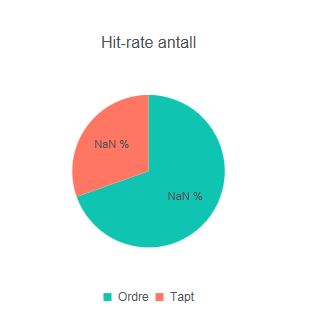
I’m trying to do the same here and are using the example that you have posted. But I’m just getting NaN % om my graphs, any idea what I’m am doing wrong?
Please, provide a screenshot of Dashboard -> Style -> Tooltip section.
Wrap your code in the Advanced tab into:
var handlers = {};
handlers.finish = function(data, logger) {
// your code here
return true;
}
Hi Dmitry
Thanks for the help so far!
I added the handler wrapping but are getting the same result, any idea or other way to show the percentage?
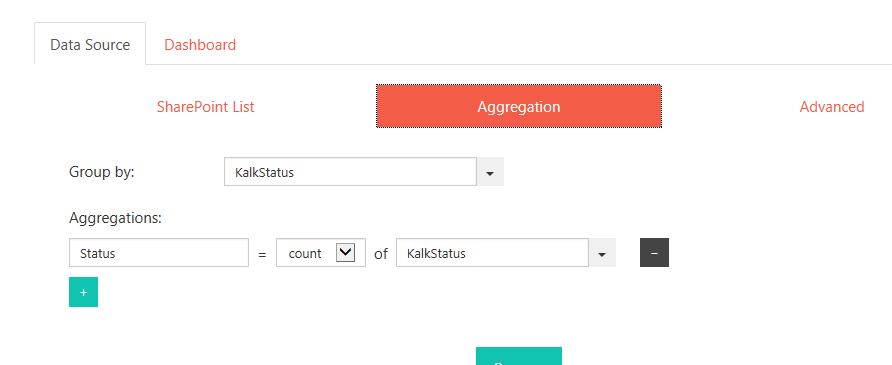
Put the code to Data source -> Advanced.
Hi,
This is regarding the same issue.
In this Ordre Count is 16.
Tapt count is 7.
I need to display it as percentage : 70% and 30 %
When I enter #=Math.round((dataItem.value*100/dataItem.sum),1)# % this calculation on
Dashboard-->Style-->Labels ----> Template I got the value as Nan%
But when I copy this code #=(dataItem.value)# % on Dashboard-->Style-->Labels ----> Template
it return as Ordre % and Tapt %. That means dataitem.value will return the value of a field not the count.
These are the screen shots. Pls help me to resolve this
Here is my screen shots of Dashboard Style and Results
Hi and also when I harcoded the sum value in DataSource—>Advanced—> handlers.finish
this won’t return on dataitem.sum on Dashboard—> Style —> Labels—> Template
Good Afternoon,
Has there been any progress on this issue? I am experiencing the same NaN% issue when following all of the steps listed above. Any help would be greatly appreciated.
Thanks,