Hallo,
We currently implementing a Sharepoint Online solution using Sharpoint Forms Designer and MS Power BI for reporting. But MS Power BI is very expensive (each user need a Pro version to view the reports!) and there are a lot of crazy bugs( if any of the used SPO-List is empty the autosynch don´t work,...).
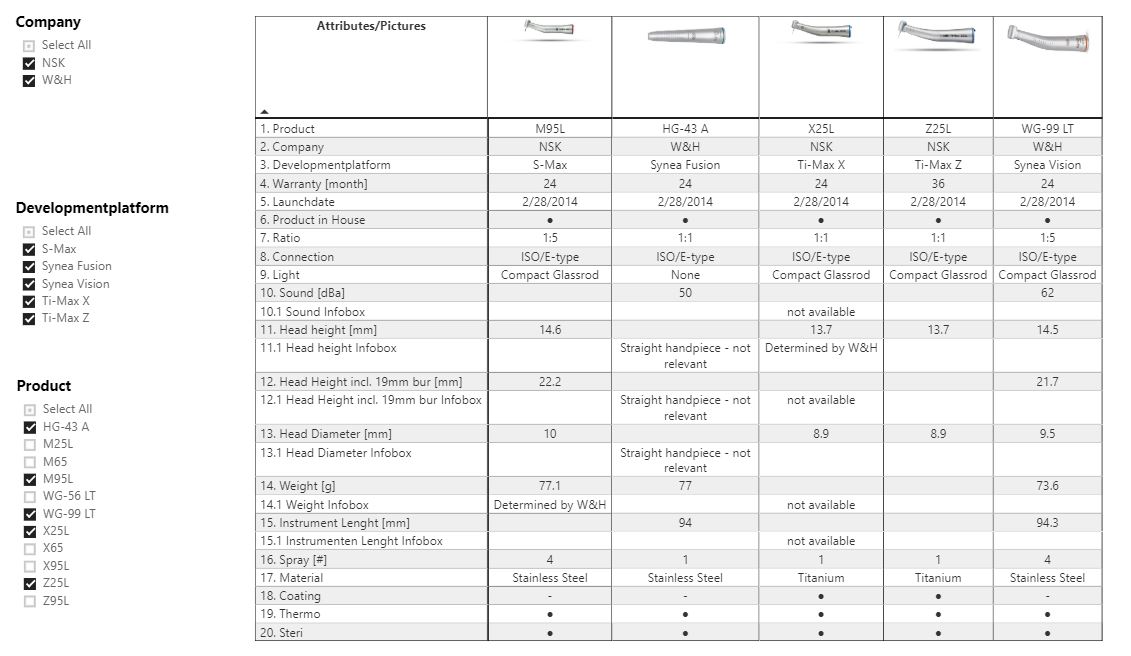
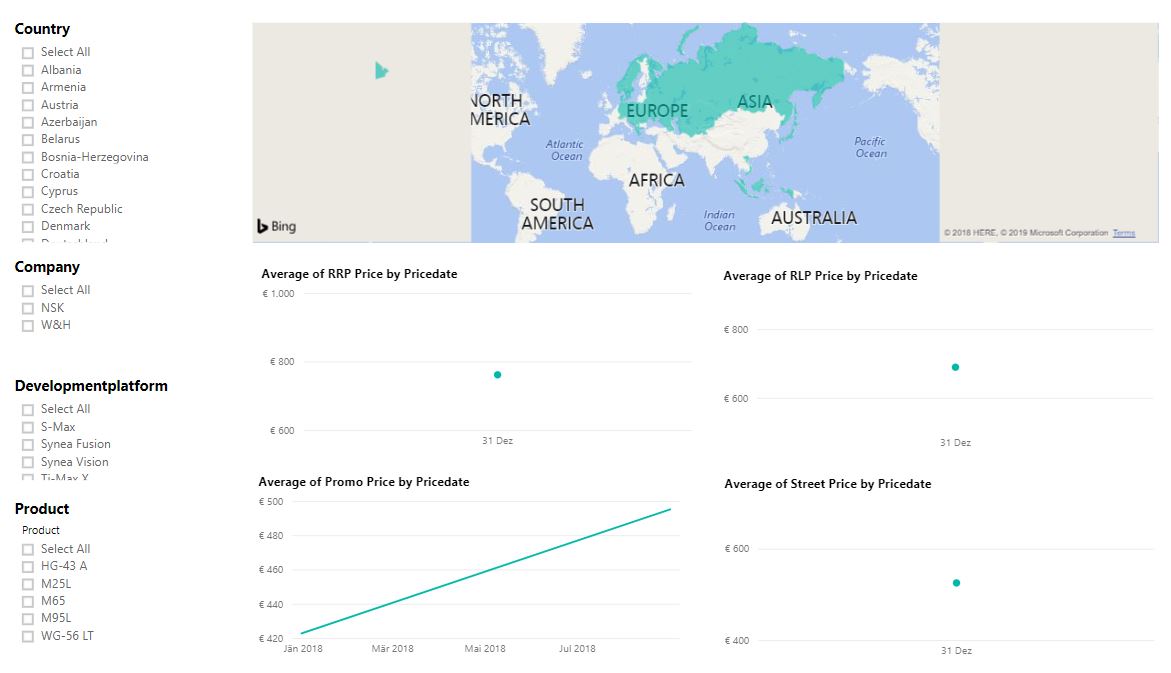
Is it possible to implement the attached PowerBI-Repots with Dashboard Designer?
Dear Johannes,
It’s true, while MS Power BI is an extremely powerful and versatile solution, it’s also extremely expensive and can be buggy. Our product does not offer all the features of Power BI, but it does offer some of the crucial ones, for the fraction of the cost.
Dashboard Designer does not use any tables for presentation though, this should be done through something else (even pure JS), and maps only support either marks or bubbles, not regions like on the example picture, but all 4 bottom charts are definitely doable. It would be hard to implement something like this, it will require a lot of custom JavaScripts, but it should be possible, at least something very similar to this.
I wouldn't count on MS. Although it's pretty powerful most of us won't us it to its fullest.
We've been using Dashboard designer now for a couple of years, in conjunction with some custom homemade stuff and my company couldn't be happier. The whole thing is Kendo based so you know it can do pretty much anything you want it to do.