Hello,
I am very new to Dashboard Designer and REST API.
Can I get a example how to retrieve data via REST API ?
Thank you !
Hello,
I am very new to Dashboard Designer and REST API.
Can I get a example how to retrieve data via REST API ?
Thank you !
Hi Fabian,
Thanks a lot for the question. Could you describe the case in more detail? Do you need to retrieve data from SharePoint Online or you use an external data source?
Ok, my case is:
I have a list with items corresponding to projects and release versions via lookup columns.
In the release versions list i can decide if a release version is active or closed.
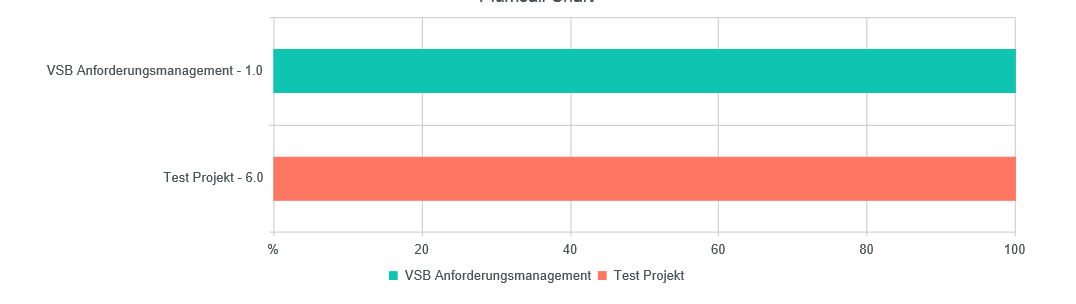
Now I want to display something like a “roadmap”. A bar chart for each project/active release version as percentage complete progress bar.
I think I can only do something like that with a REST API Call
There is no need to use REST-api. You can retrieve data from multiple lists with the help of CAML-query on the Data Source -> List tab. Please, find a sample on our demo website (Revenue distribution by category and country):
http://www.spchart.com/demo/ceo-dashboard
http://www.spchart.com/demo/ceo-dashboard/config#rev_by_country
Thanks, I got it.
Now I solved it to display only the Project - Versions which is active with
handlers.requestSuccess = function(data, logger) {
$.each(data.items, function () {
if(this.targetrelease_x003a_active == 'yes')
this.ActiveTargetrelease = this.Project + ' - ' + this.targetrelease;
});
return true;
}
and display it on category axis.
My Problem is: I want to display only the percentage number of all items whose completed in relation of the maximum number of all items of a ActiveTargetrelease.
Can you help me ?
Hi,
I guess the following sample may help you, it implements a quite similar case (Sprint and Project Burn Rates):
http://www.spchart.com/demo/project-dashboard/config#project_burnrate
http://www.spchart.com/demo/project-dashboard