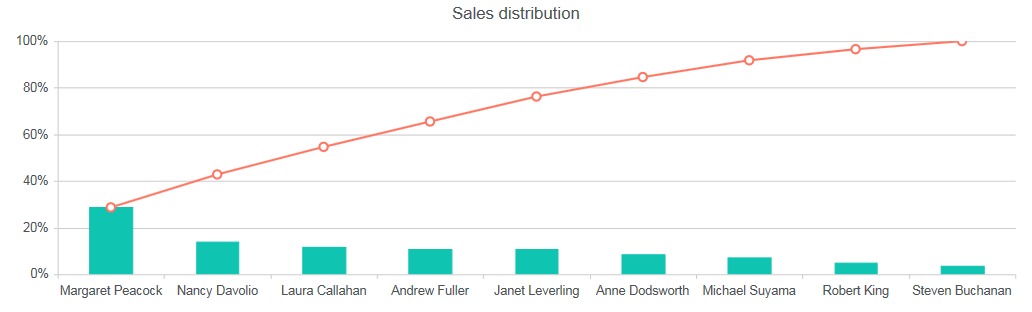
I am building a chart similar to the Sales distribution chart.
Is it possible to filter the new cumulative data series so the red line graph only shows results for a specific SalesRep (e.g. Margaret Peacock)? The column graph would still include all SalesReps.
Hi,
Not sure that I got the requirements. If the red line shows results for a specific person, it will be transformed to a point. Currently, each column displays result for each person. Could you provide a sample?
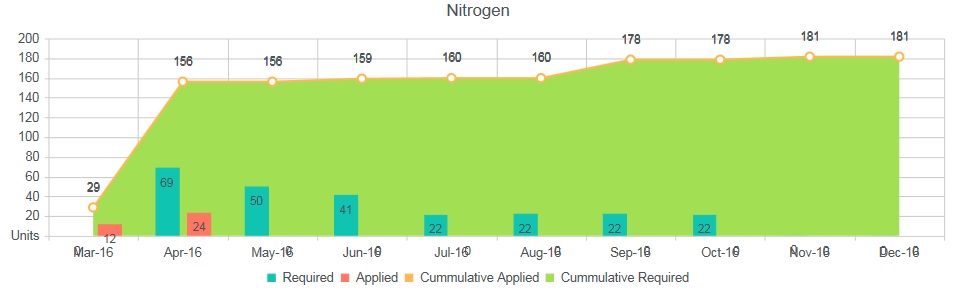
Attached is my unfinished graph. The x-axis is a Date field, aggregated by months, so the Sales Distribution graph was not a good example for me to use, sorry.
Values in the bar chart series are summing Nitrogen (this.N) correctly, and also reporting Applied separate to Required by month as needed (Grouped by "Data Type" to show results for Applied versus Required separately).
I need to add another two series to this graph:
a line series to show Cumulative Applied results
an area series to show Cumulative Required results
These are displayed on the attached screen shot but the results are not filtered or summed correctly.
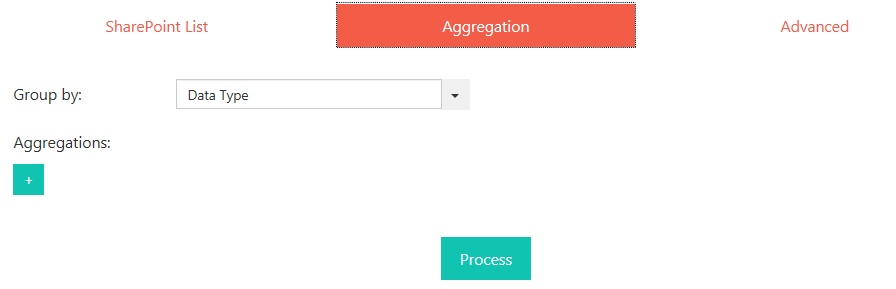
Referring to the Advanced screen shot, I haven't been able to work out how to filter the line series to only include and sum this.N if Data Type = 'Applied'. And likewise, to filter the area series to only sum this.N if Data Type = 'Required'
Any direction you can give would be much appreciated
Did you group items by ‘Data Type’ on the Data source -> Aggregation tab? You have not attached a screenshot of the ‘Aggregation’ tab that’s why I’m asking.
If so, you need to use data from the first series (Required) for the area chart and data from the second series (Applied) for the line chart.
Yes items are grouped by 'Data Type', screen shot is attached this time. I can only attach 3x images at one time so left it off the last post, sorry.
Thanks to you the penny finally dropped for me. I know understand how to filter results by altering config.series[0].data, thank you!
My cumulative results however are not summing correctly. Is this because I need to add an Aggregation to sum 'N' (e.g. Total = sum of N)?, and include 'Total' in code on Advanced tabs similar to how it is done on the Sales Distribution example? Because I tried this and get zero results for all series. I can persevere with this setup but thought I would ask first if I am on the right track, or if there is something more obvious I am missing which is causing the sum results to be wrong
The problem is that you aggregate data by months. The case a bit more complicated than I thought before. Our support team can help with the code, it will take 100 support minutes. If it suits you, please, pay for the support minute in our store: https://plumsail.com/sharepoint-dashboard-designer/store/#!/100-minutes/p/17765967/category=11274284
And send the list template (List settings -> Save list as template -> tick Include Content) and the chart (export settings in Dashboard Designer) to support@spchart.com.